Ship Smart Central
Multi-role SaaS workflow platform
92% vendor compliance · 60% fewer status calls · 40% fewer follow-up emails
Overview
Ship Smart Central is a multi-role operations platform that aligns Vendors, Customer Service, Operations, and Sales around a shared shipment lifecycle, creating a single system of record from quote to delivery.
Ship Smart relied on third-party vendors to execute shipments but lacked a centralized system to manage status updates, ownership transitions, and cross-team visibility. After pickup, customers had little predictability, support was overwhelmed with status inquiries, and internal teams operated across disconnected tools.
I led the design of Ship Smart Central, a multi-role operations platform that unified vendor input, lifecycle state management, and automated customer communication into a shared system of record.
The root issue wasn't communication. It was the absence of a shared lifecycle model defining shipment state, ownership, and system behavior. Without that foundation, every update required manual coordination, resulting in inconsistency across teams.
"The problem wasn't visual; it was a broken system of record with no shared lifecycle logic, no vendor accountability layer, and no proactive customer communication."
The solution replaced reactive, email-driven workflows with structured lifecycle states, role-based dashboards, and event-triggered communication tied directly to shipment state changes.
This system became the operational backbone for tracking, updating, and communicating shipments across the business, reducing support demand, improving vendor accountability, and increasing customer confidence through predictable system behavior.
Operational Impact
Measured 12 months post-launch across support, vendor, and customer workflows
EFFICIENCY
$5.86
saved per support call
60%
reduction in status-related calls
40%
reduction in follow-up emails
CUSTOMER EXPERIENCE
17%
increase in CSAT
| Increased predictability after pickup
| Proactive, event-driven communication
OPERATIONAL PERFORMANCE
92%
vendor update compliance
23
lifecycle states automated via SendGrid
| Shared system of record across four teams
Role: Lead UX & Product Designer
Responsibilities: Research · Workflow and System Modeling · Lifecycle State Design · Visual Design · Systems Thinking · Stakeholder Facilitation · Cross-Functional Collaboration · Prototyping
Tools: Figma · SendGrid · Jira · Chat Transcript Analysis · Support Call Review
Timeline: 12 Months
What I Owned
| Diagnosed the root problem as a system architecture failure, not a communication issue, and reframed the project scope around that
| Defined Ship Smart's first shared lifecycle model, establishing what each shipment state meant and who owned it at every stage
| Proposed and drove the system of record architecture across four roles with competing priorities
| Introduced KPI instrumentation across all team surfaces, enabling the business to measure operational performance for the first time
| Secured leadership alignment on a significantly expanded scope beyond the original brief
| Established a shared system that reduced duplication across teams and accelerated future product development
My Process
Design Question
How might we build a shared system of record that makes shipment state visible across vendors, operations, and customers so that every role has the information they need without requiring manual coordination?

Research & Discovery
The research for Ship Smart Central drew on the same platform-wide initiative that informed the Product Operating System, including 160+ hours of recorded support calls and stakeholder interviews across sales, operations, and vendors. For Central specifically, the support call analysis revealed that 49% of all customer questions were status-related, which became the design brief.
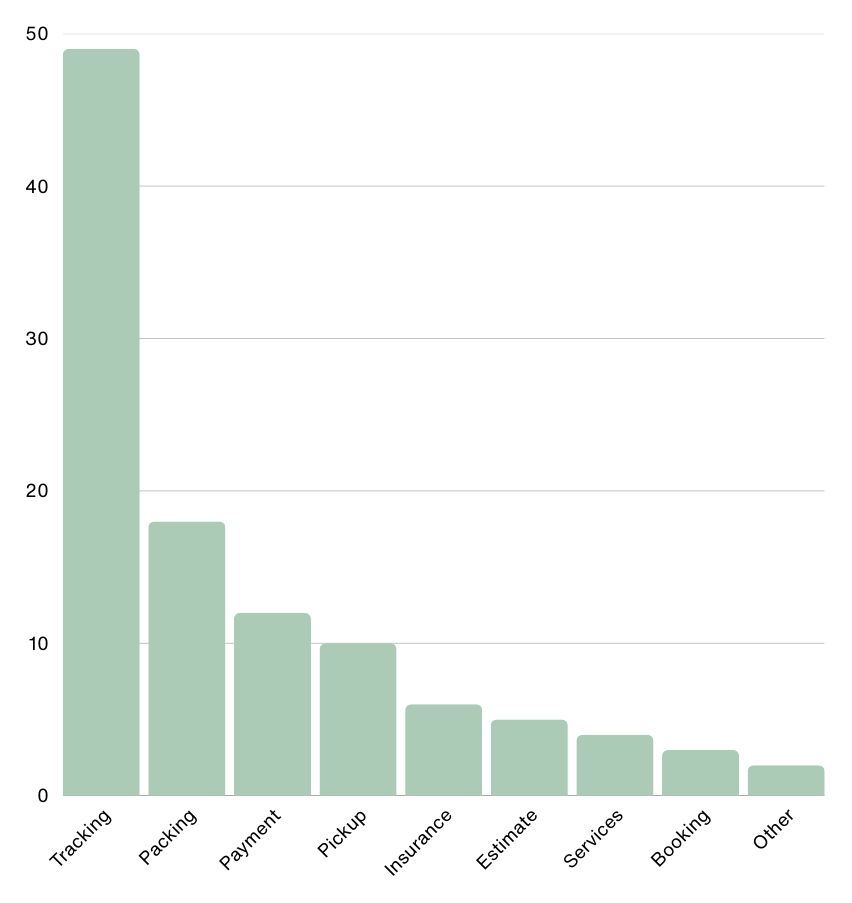
49% of questions were about status.
80% of all customer inquiries are based on the same 30 questions.
21% were follow-ups due to a lack of communication.
Customer Support Questions By Category
Method
Reviewed 160+ hours of support calls
Analyzed 2,783 chat transcripts (95% confidence sample)
Shadowed support as an interim manager
Audited vendor fulfillment threads
Mapped quote → pickup → delivery workflows
Interviewed Stakeholders
Benchmarked top competitors in shipping/tracking UX
Voice of Customer

Understanding Customers
Customer reviews at the start of the project. The same pattern surfaced repeatedly: no updates after pickup, no visibility, no follow-through.
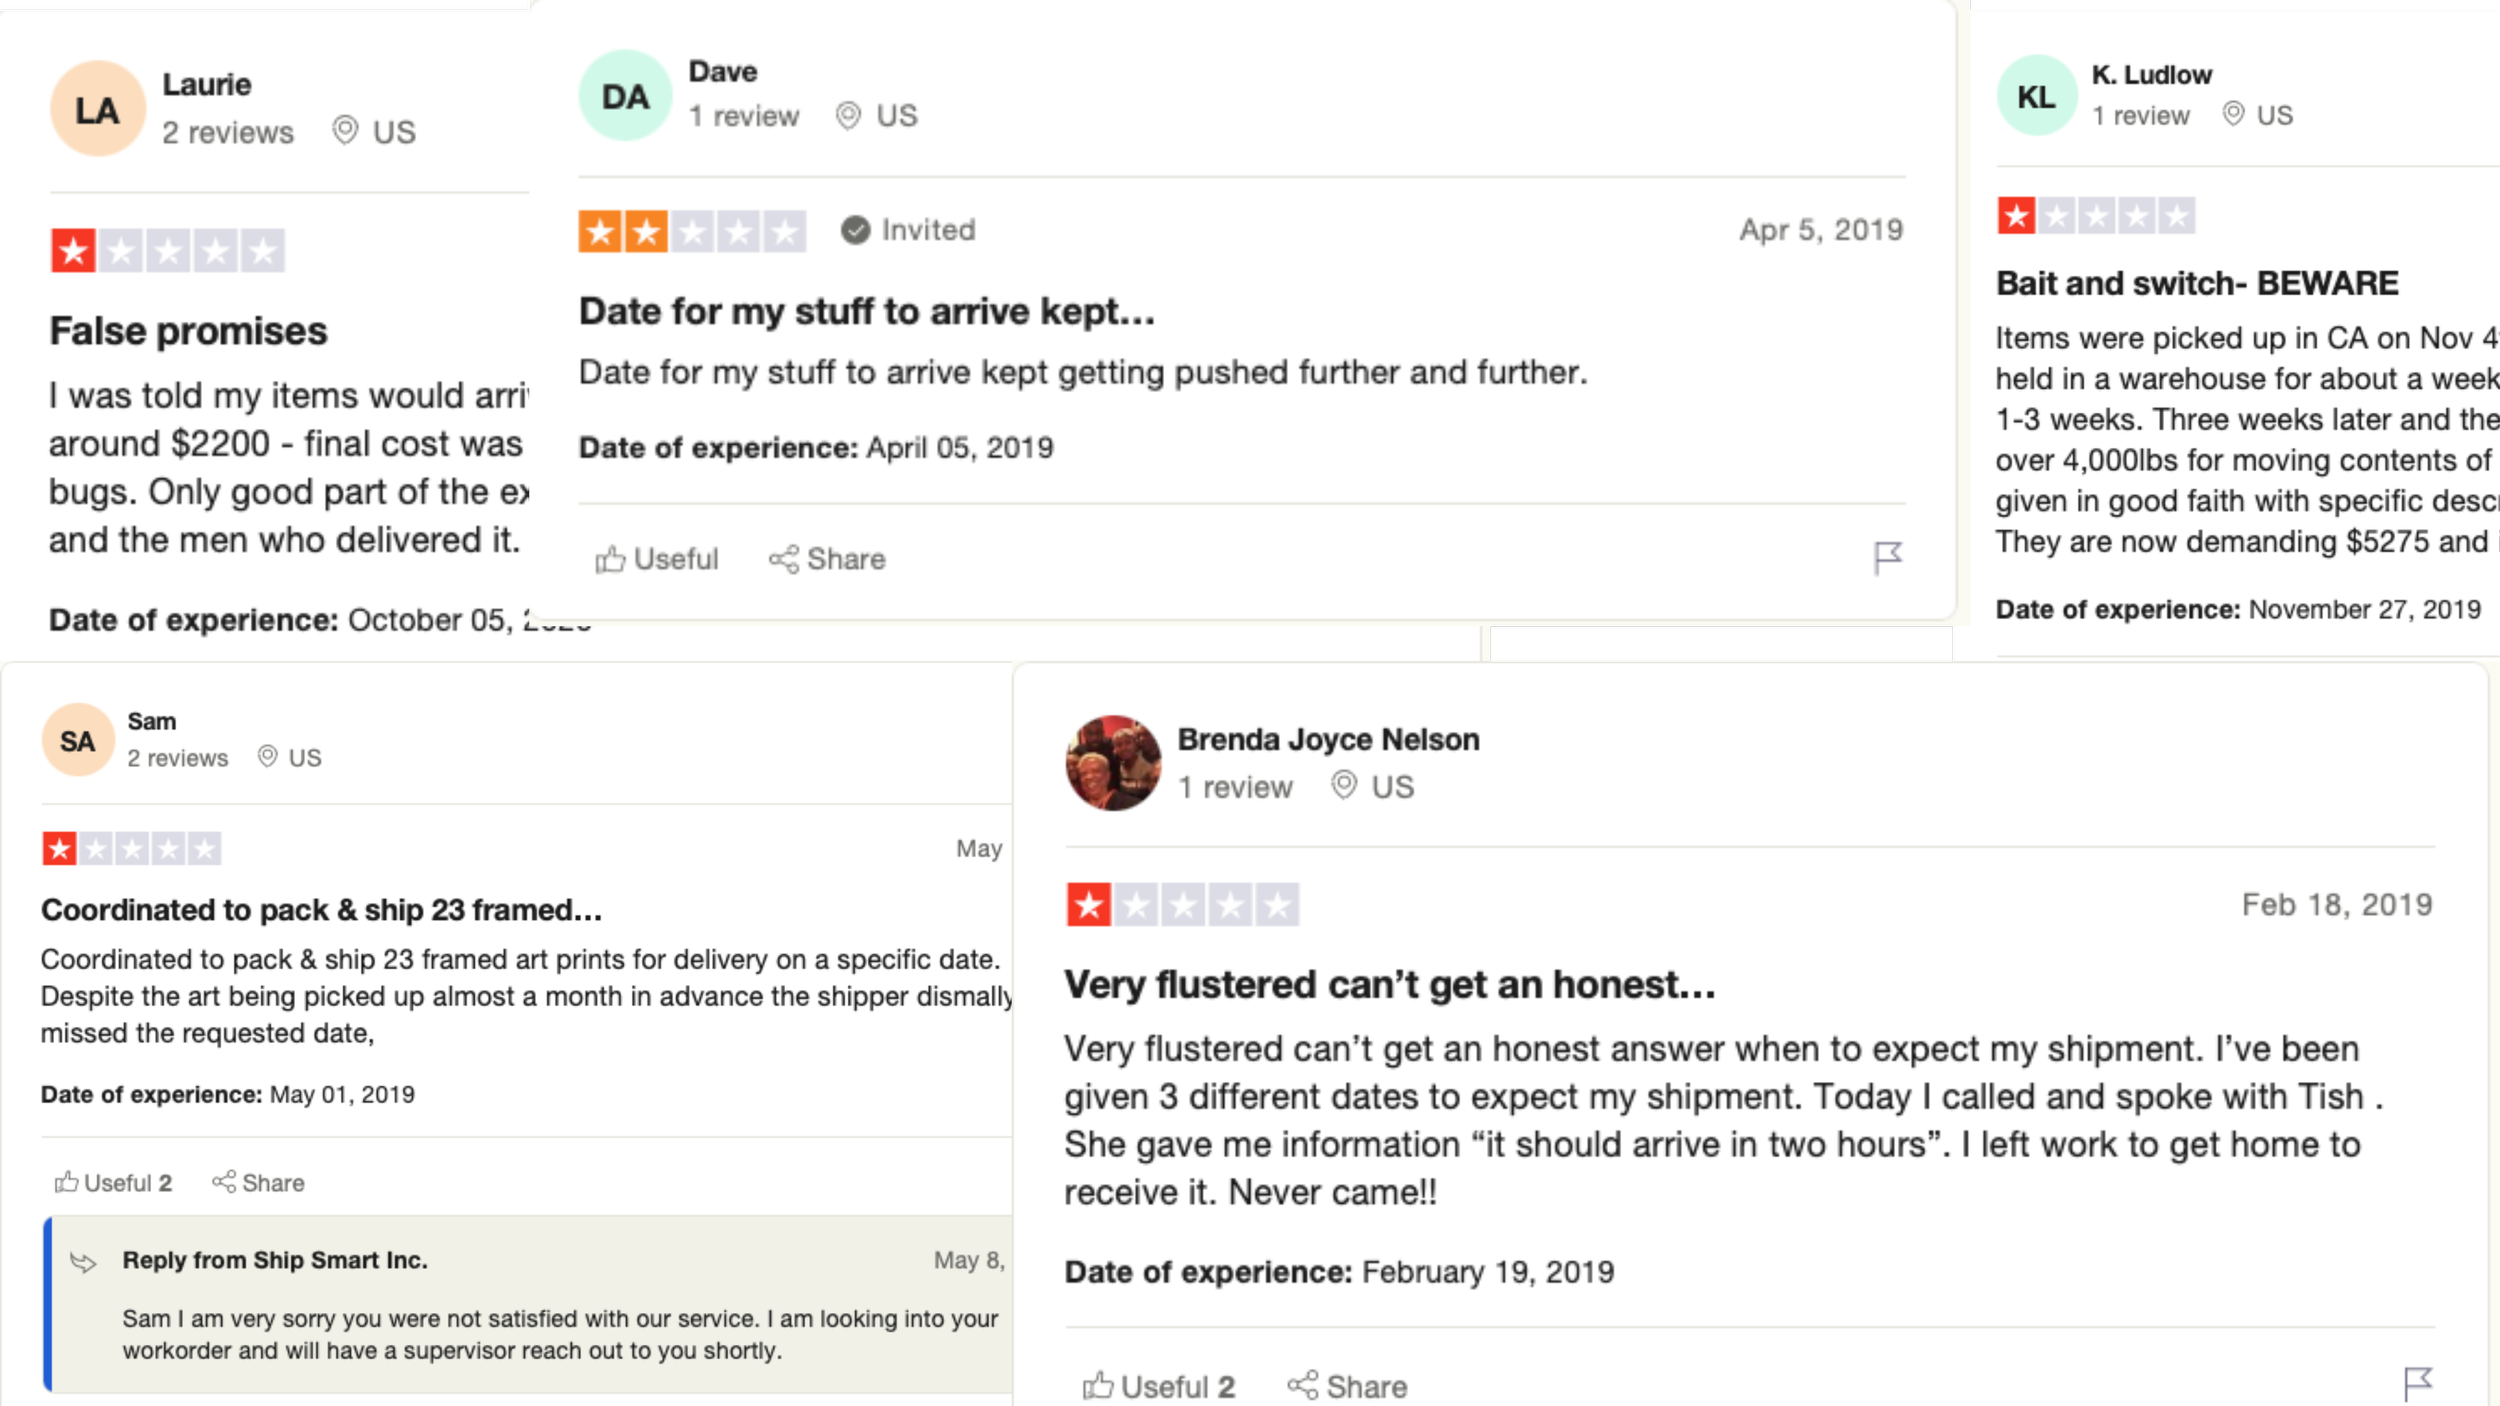
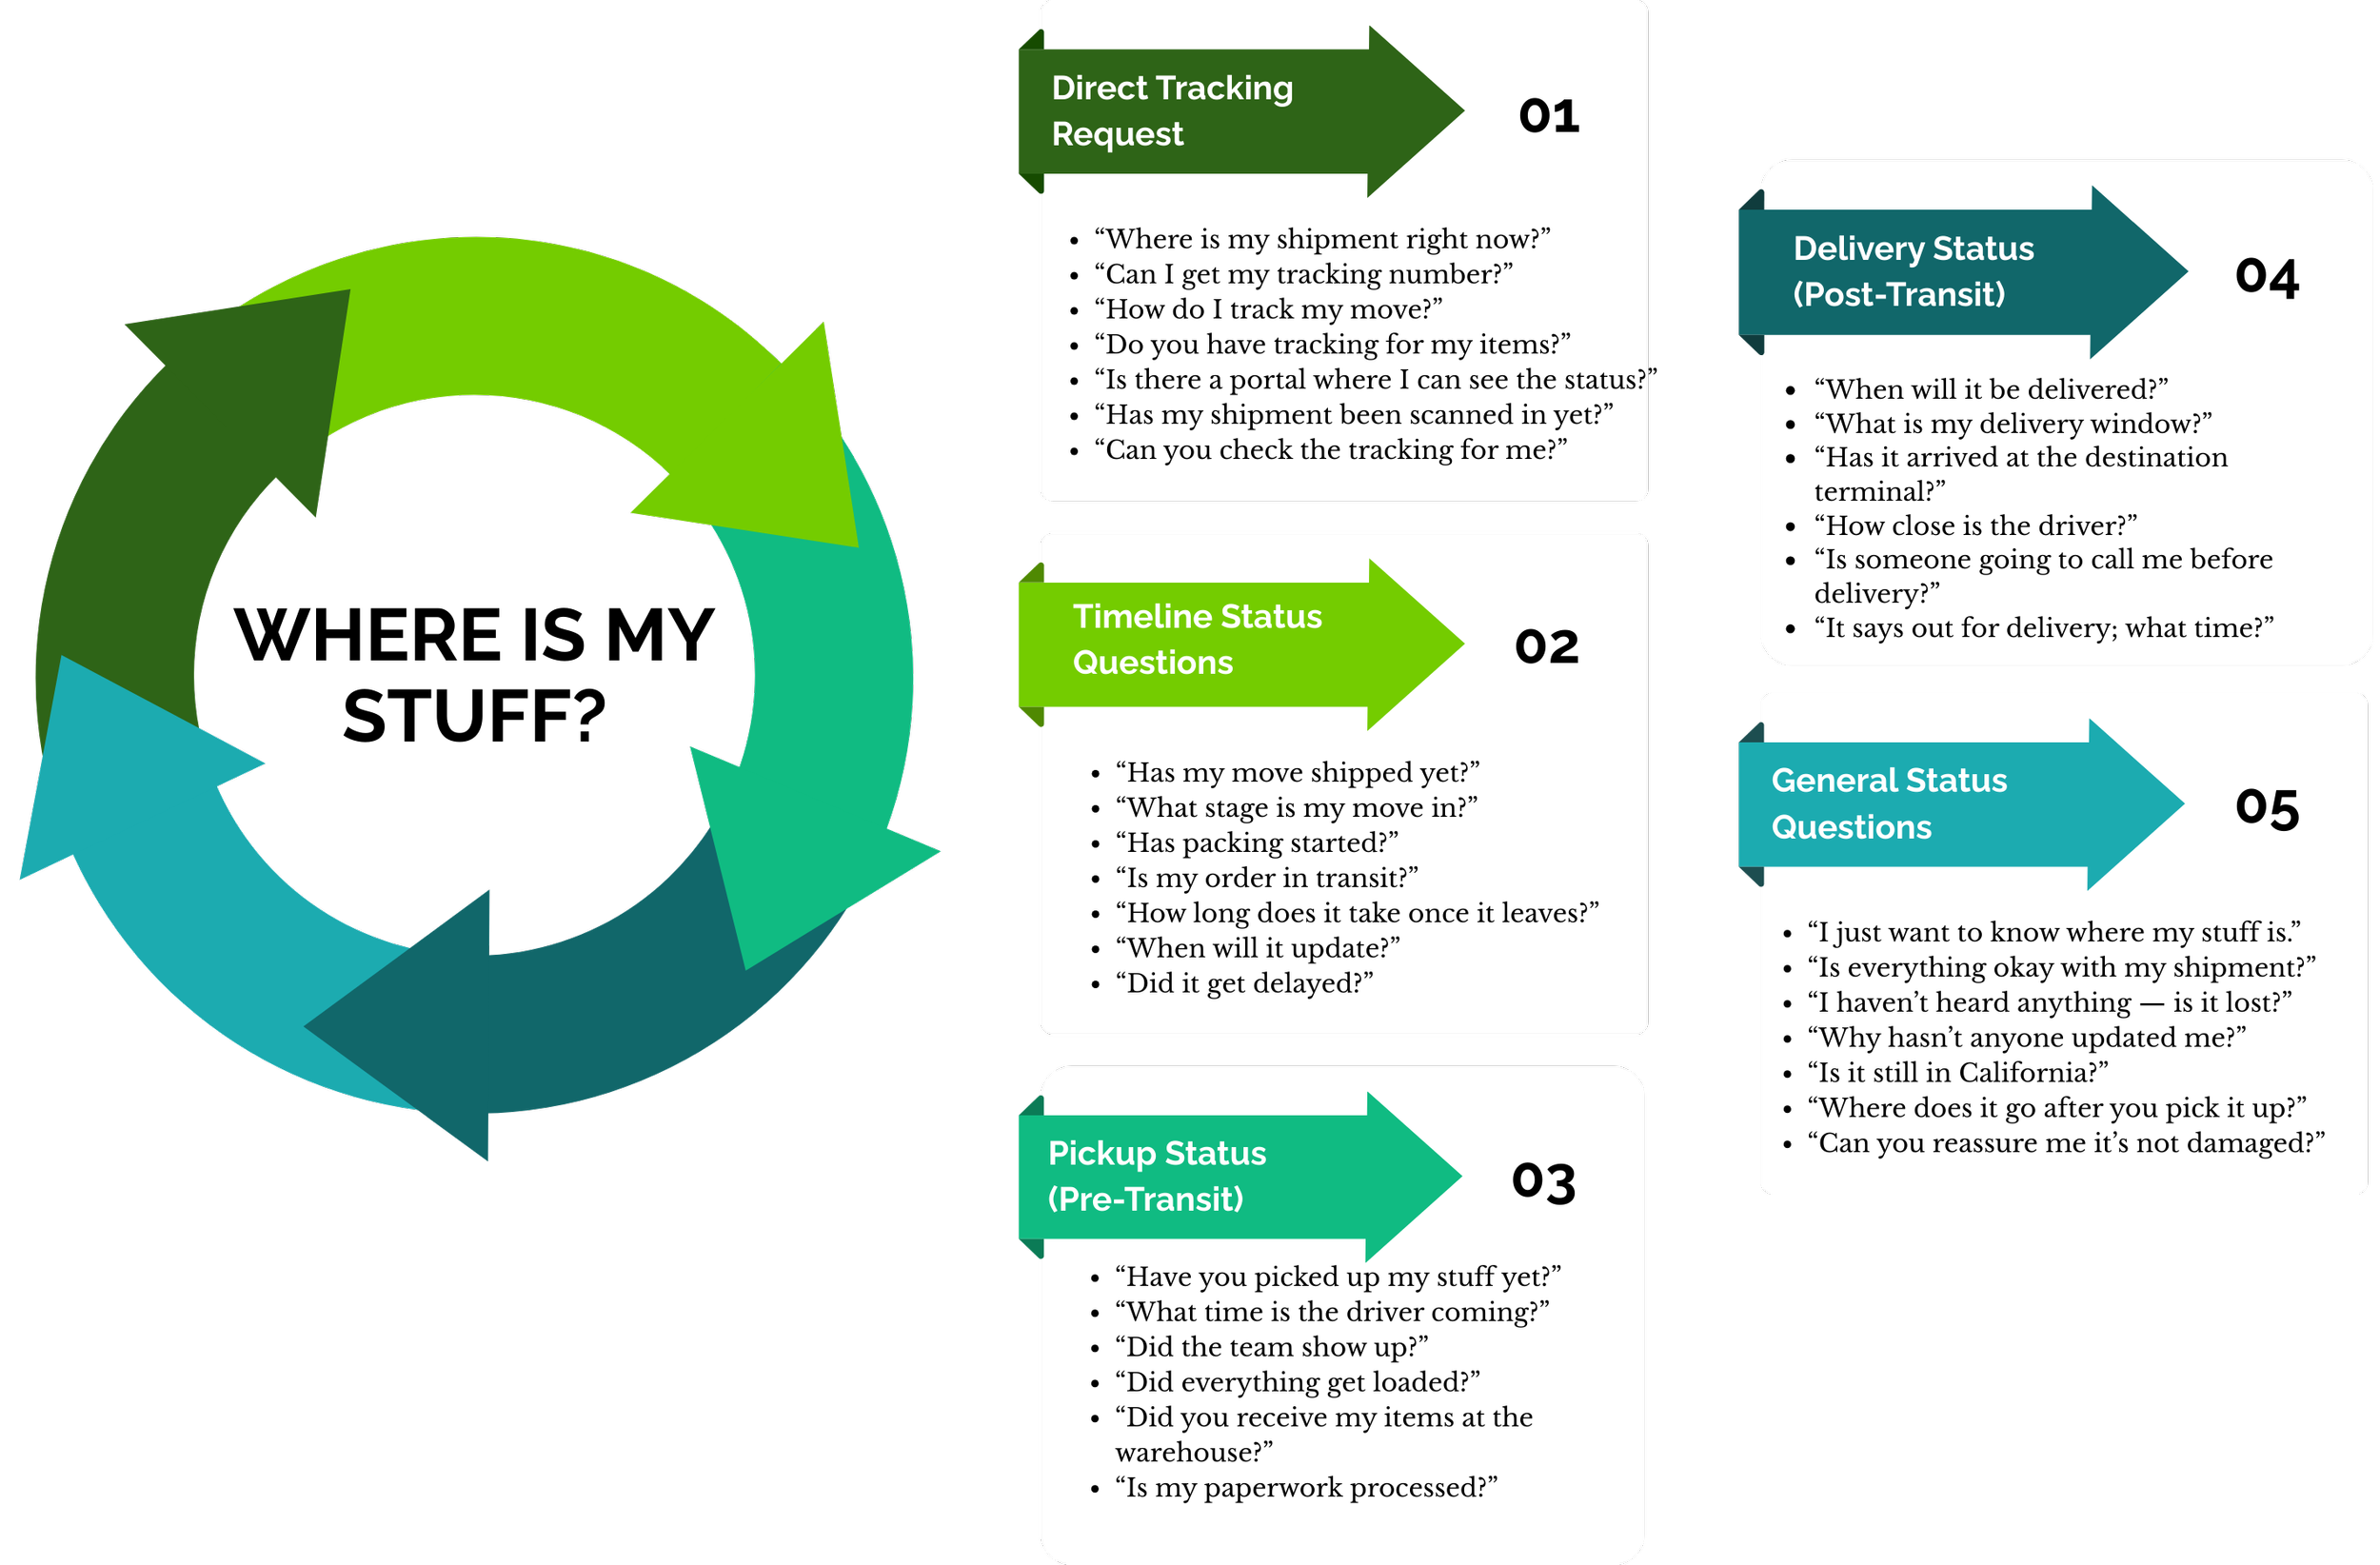
Customer Question Patterns
The issue wasn’t complexity; it was predictability. Customers didn’t understand where their items were or when they would arrive, and support couldn’t keep up.
Key Insights
No shared lifecycle model defining shipment states. Support call analysis showed that no single system tracked a shipment from quote through delivery, meaning every status update required someone to manually check across three disconnected tools.
Operational strain caused by manual coordination. No automated handoffs meant every update required human intervention. Ops, CS, and Sales were each working on partial subsets of the same data without a shared view of what had already happened.
Vendor update gaps are creating trust breakdowns. Vendor fulfillment thread audits showed that update delays of 24 to 72 hours were common after pickup, the exact window when customer anxiety peaked, and support calls spiked.
Reactive support escalation due to unclear ownership. When a problem surfaced, a discrepancy, a delay, a missed pickup, there was no defined owner. Issues escalated by default because no role had the tools or authority to resolve them independently.
Inconsistent status visibility across teams. 21% of all customer contacts were follow-ups to questions that had already been asked, confirming that the first response had not resolved the underlying uncertainty about ownership and next steps.
Unclear timeline expectations after pickup. Customers had no visibility into what happened between pickup and delivery. Without a predictable timeline or a proactive communication layer, every information gap became a support contact.
Customer Journey Mapping
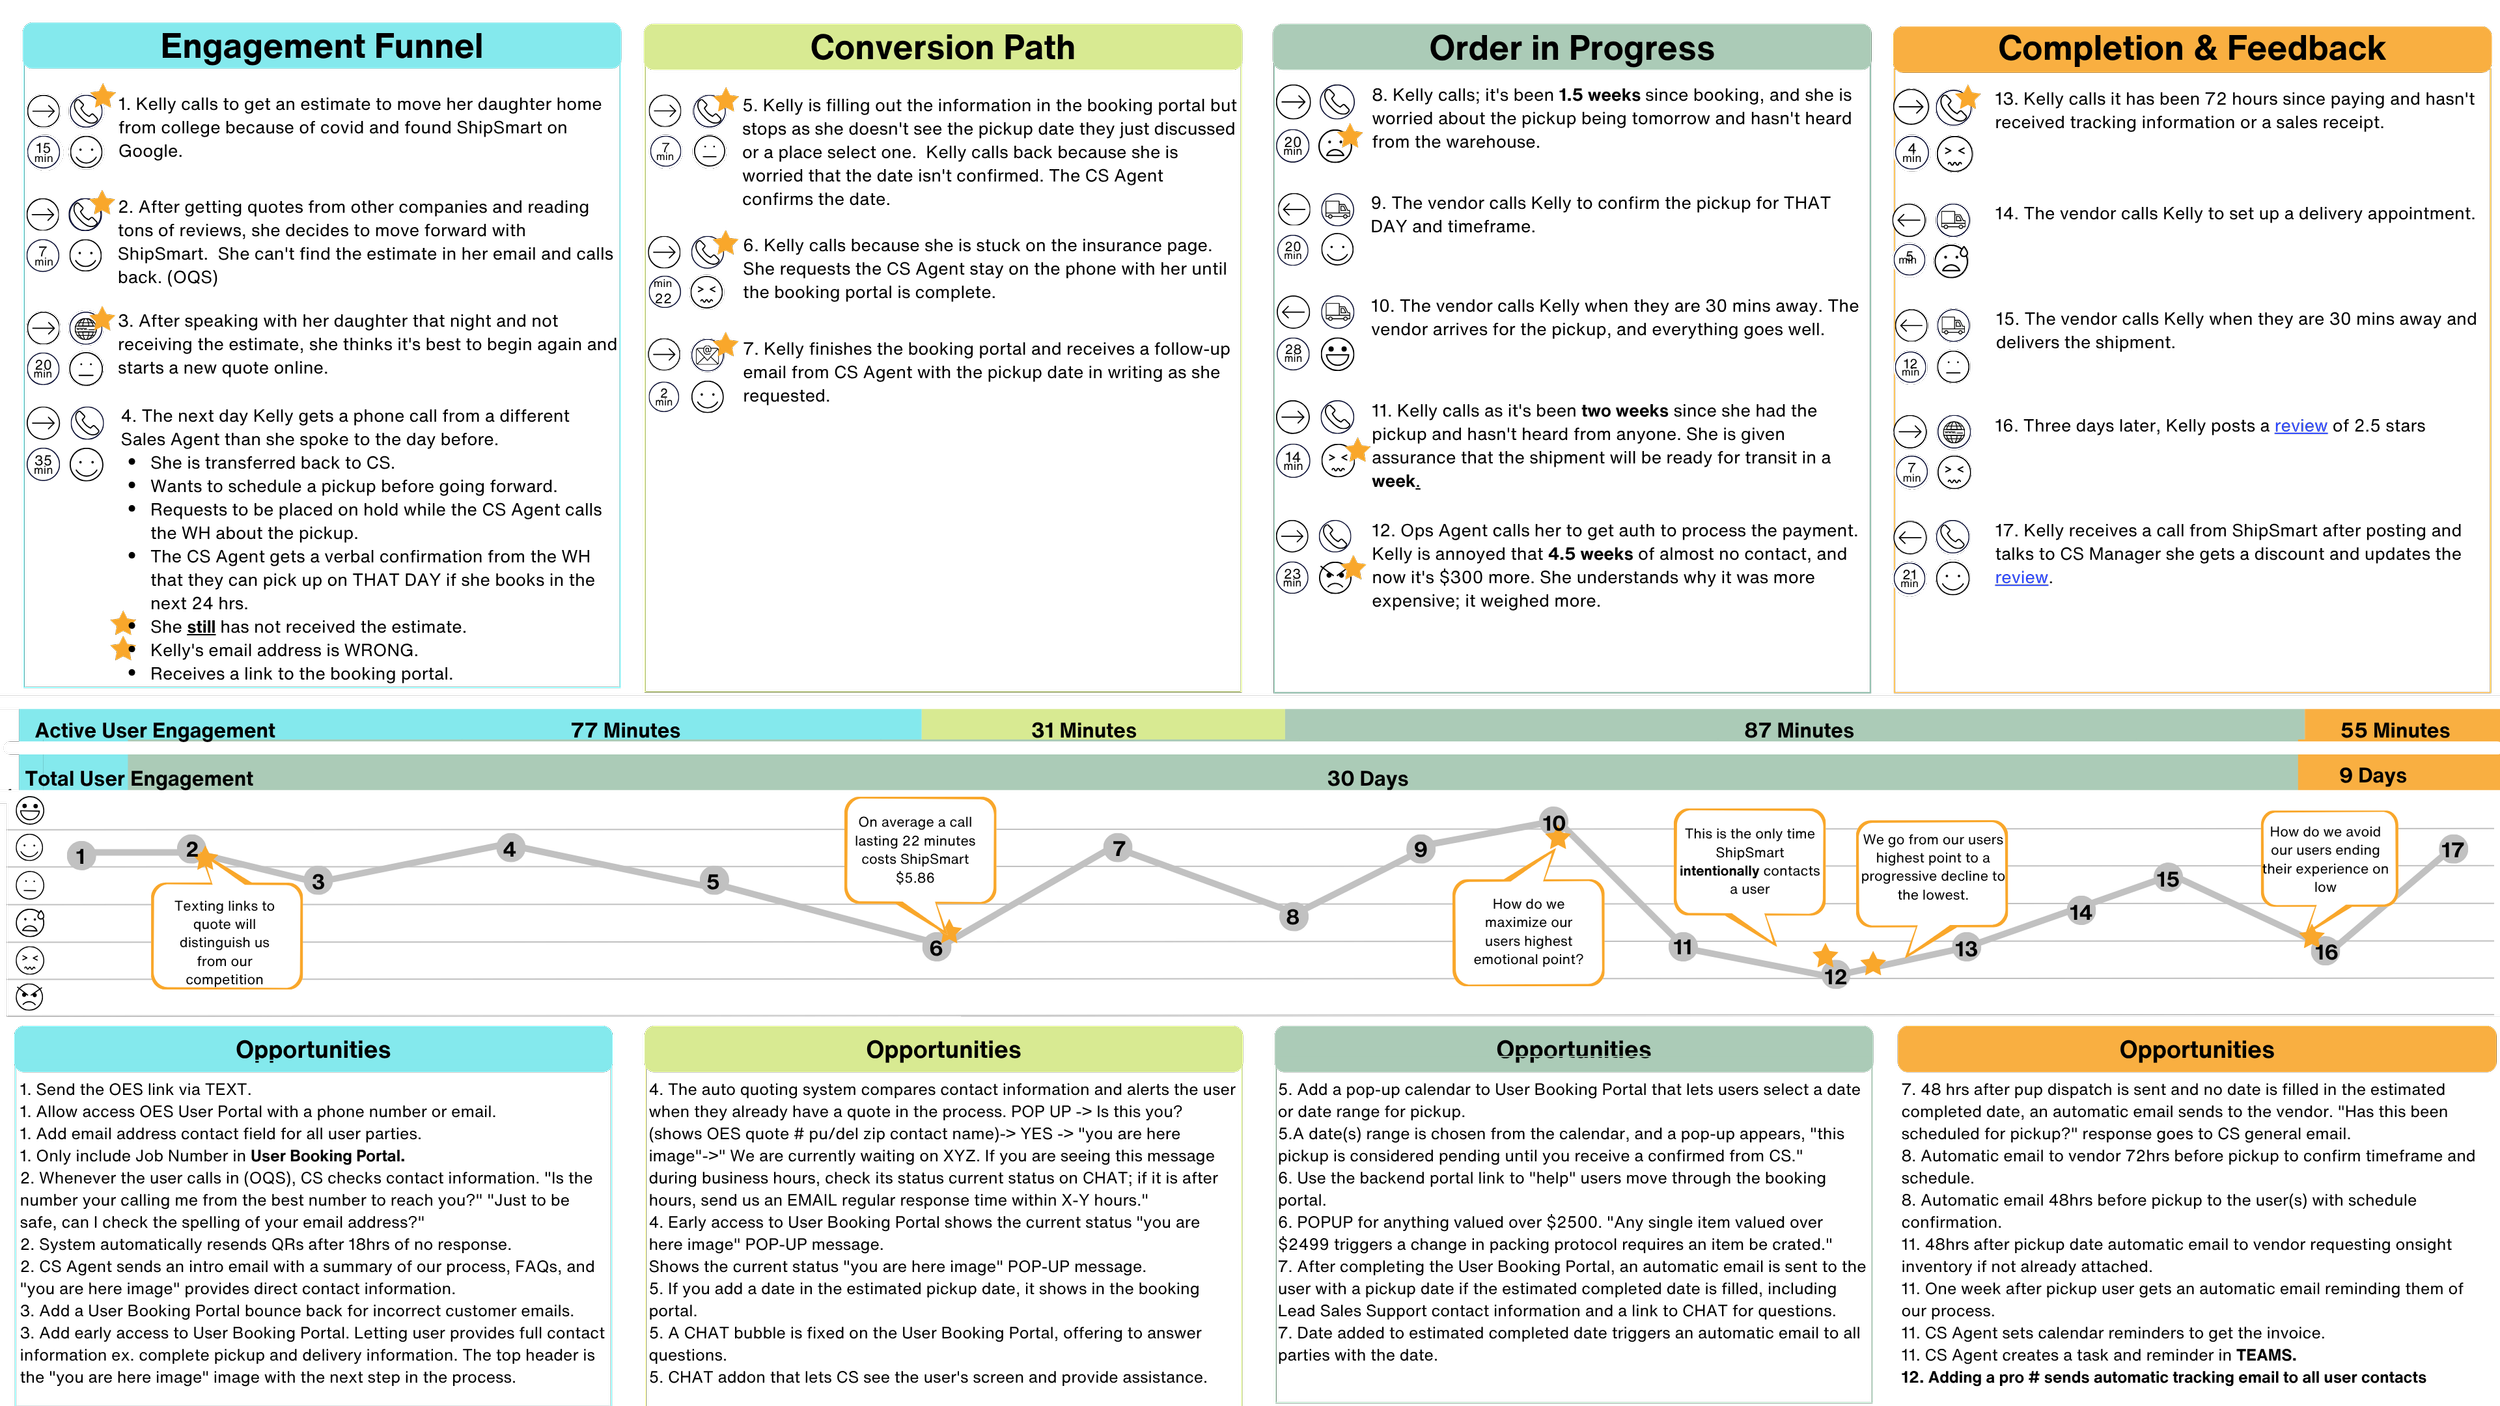
Mapped quote → pickup → delivery and found: Journey mapping confirmed that post-pickup was the highest-anxiety phase of the entire experience. Once a shipment left the customer's hands, they had no visibility, no timeline, and no clear point of contact, a gap that surfaced directly as the 49% status inquiry rate.
The journey map became the team’s evidence artifact: it made the problem visible to stakeholders who had only seen it through one role's perspective, and it framed the post-pickup gap as a systems design problem, not a customer service capacity problem.
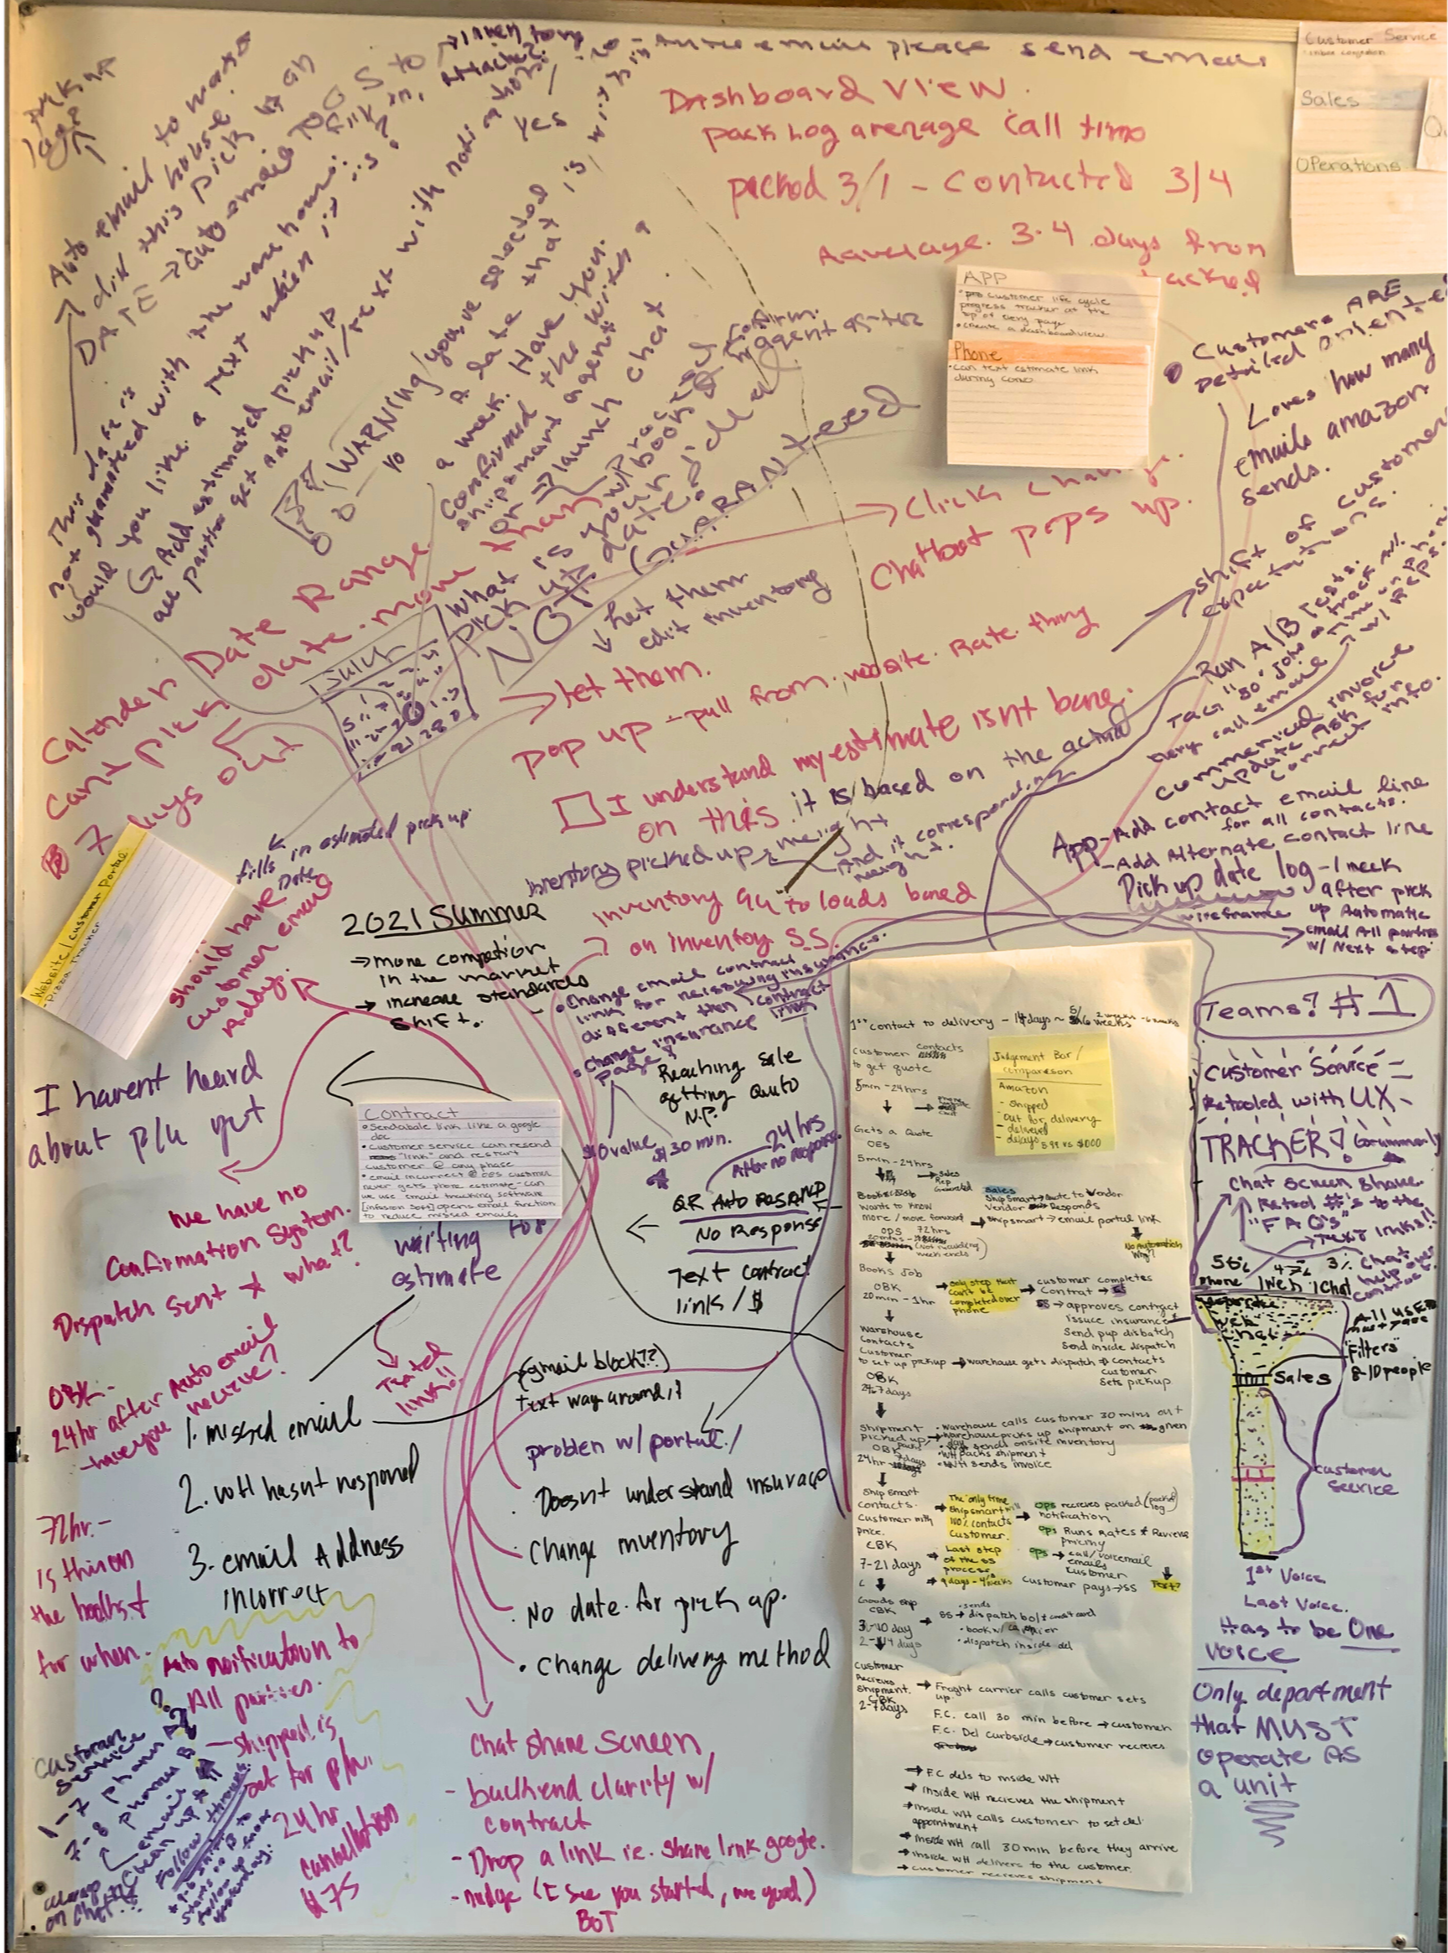
Service Blue Print
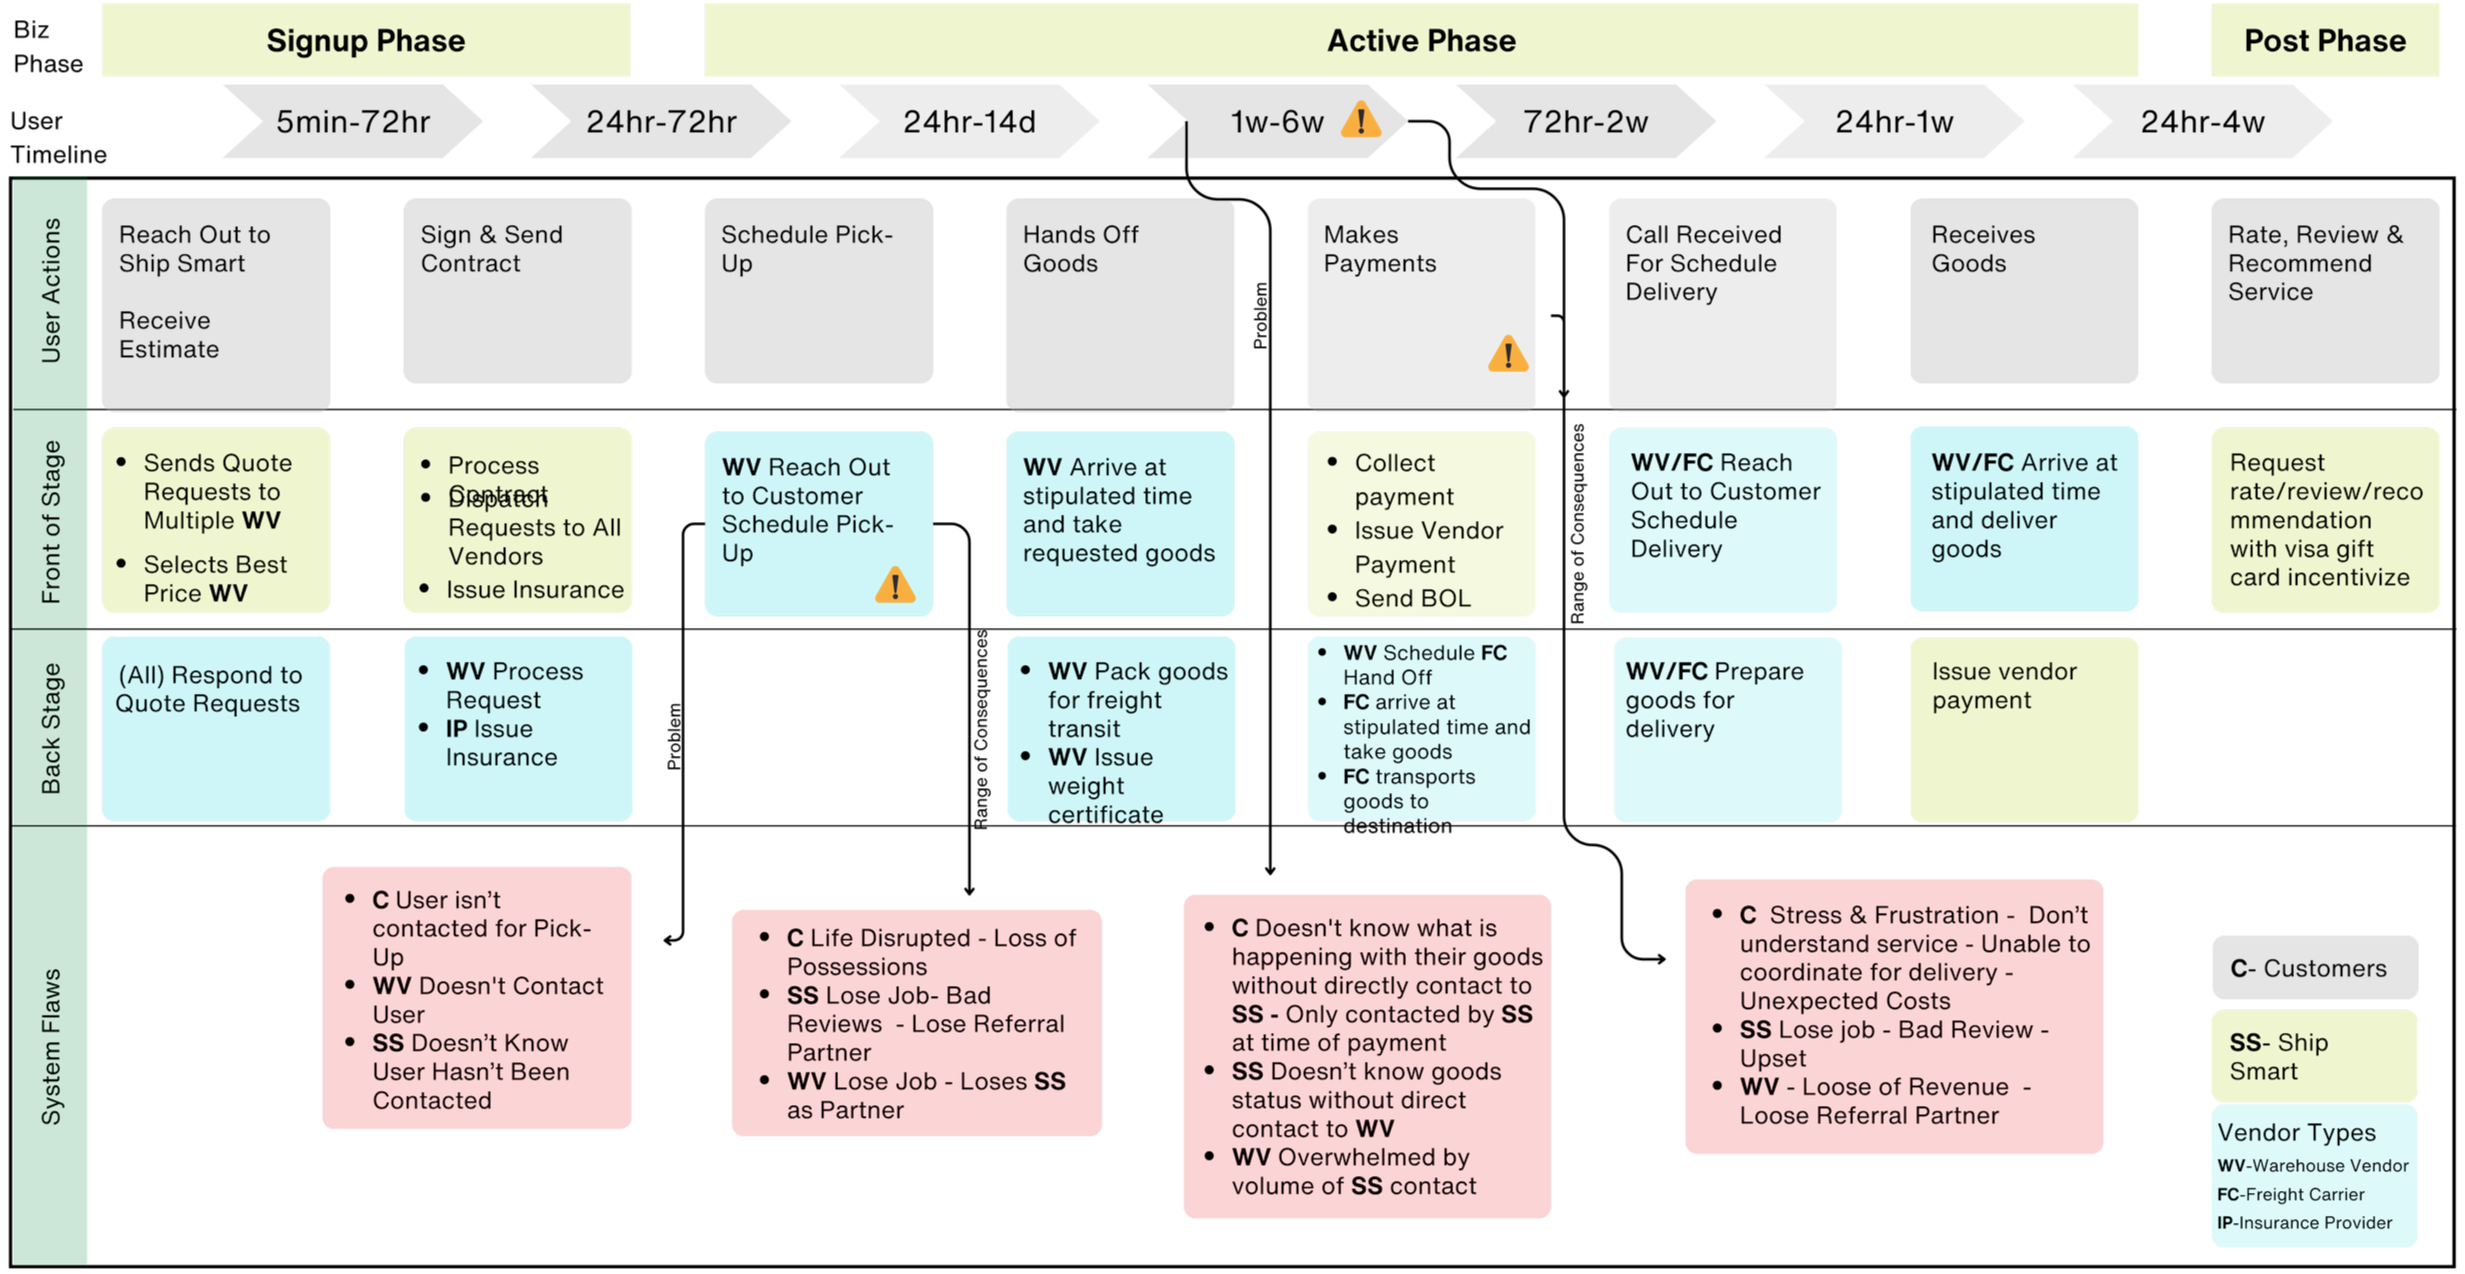
I mapped every tool, handoff, and communication touch point across the full shipment lifecycle. The blueprint revealed a consistent pattern: vendor input, internal tools, and customer-facing communication operated on three separate timelines with no shared trigger logic. Bringing all four roles into the same room for the first time revealed that each team had already identified parts of the problem independently, but lacked a shared framework to connect them. The blueprint provided that framework.
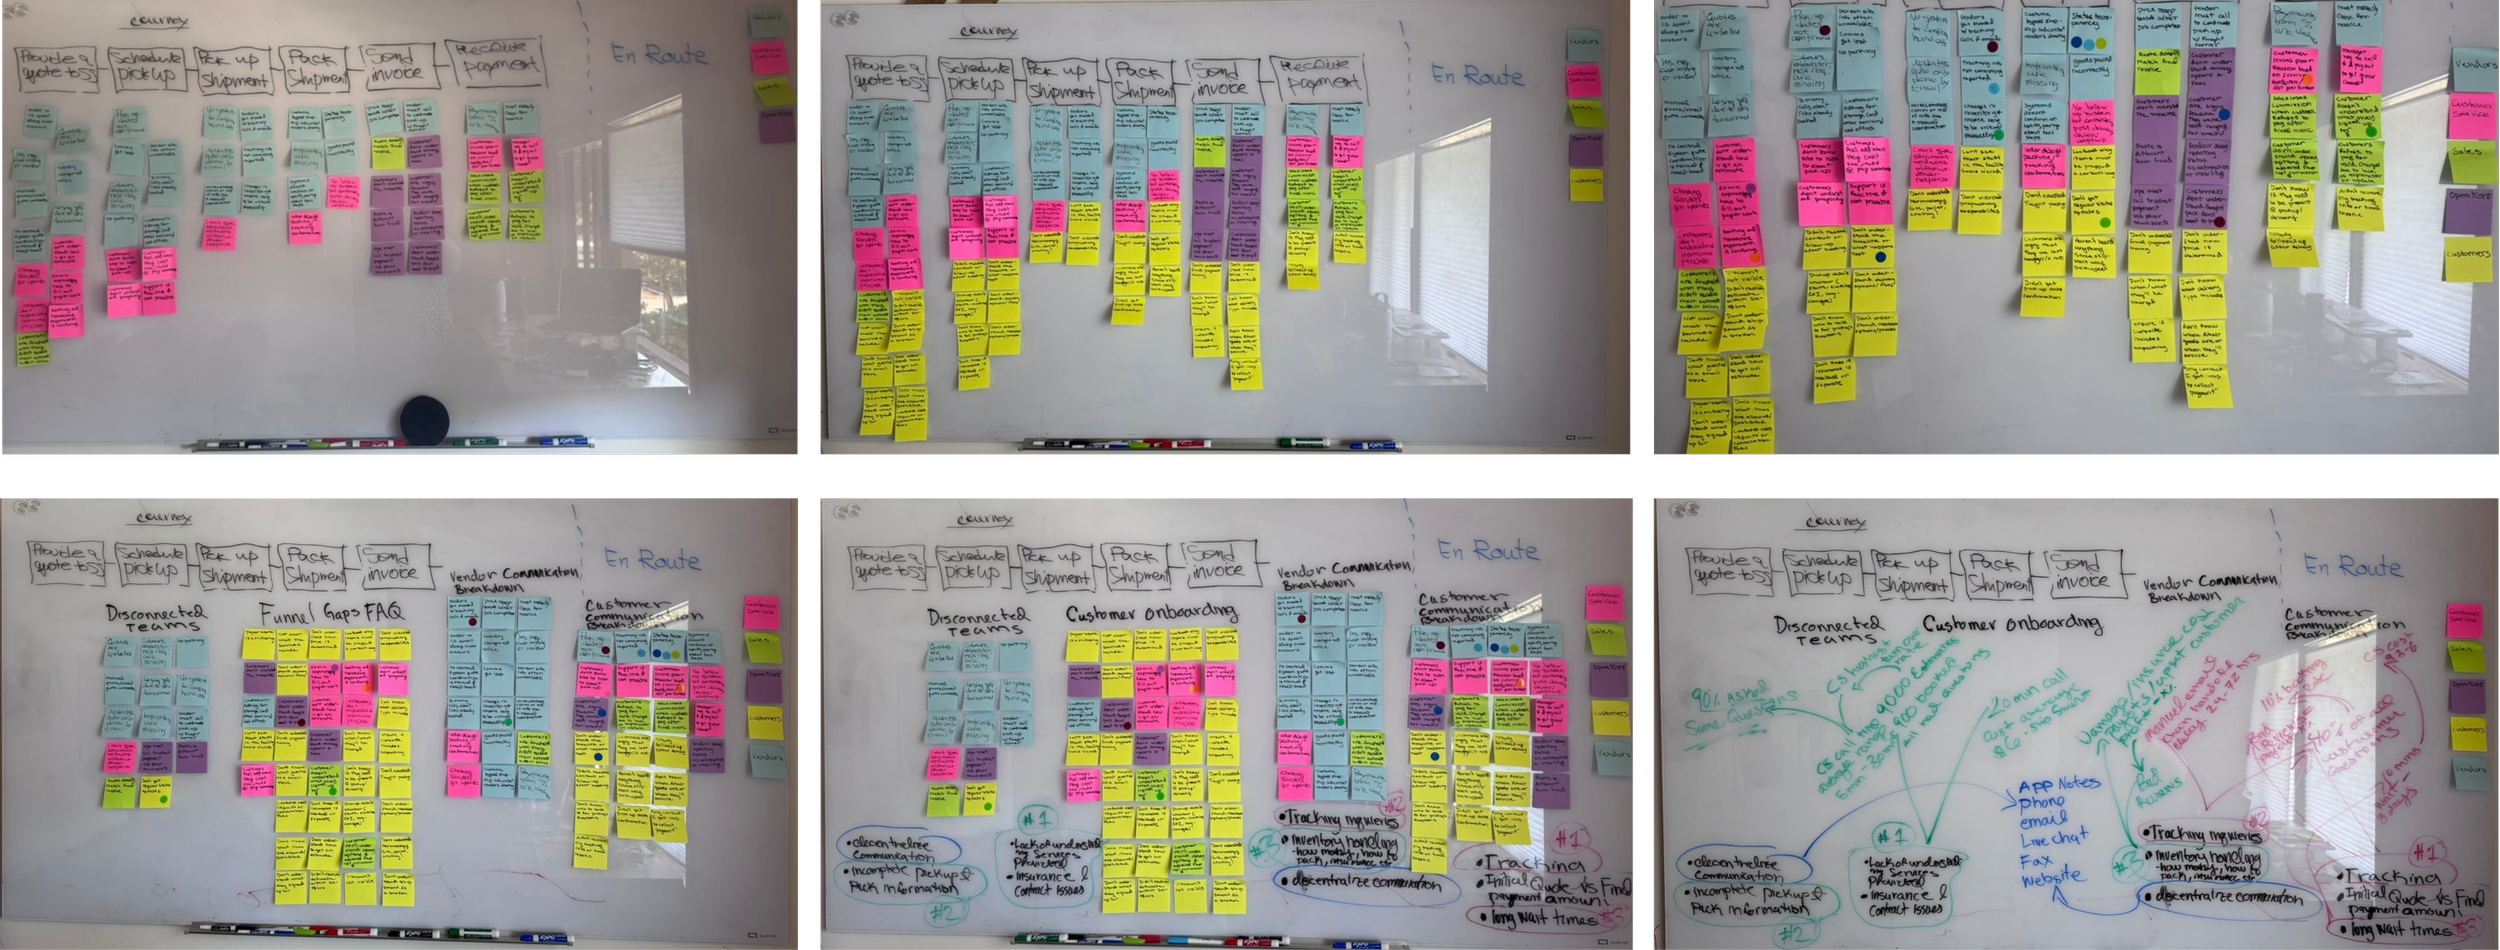
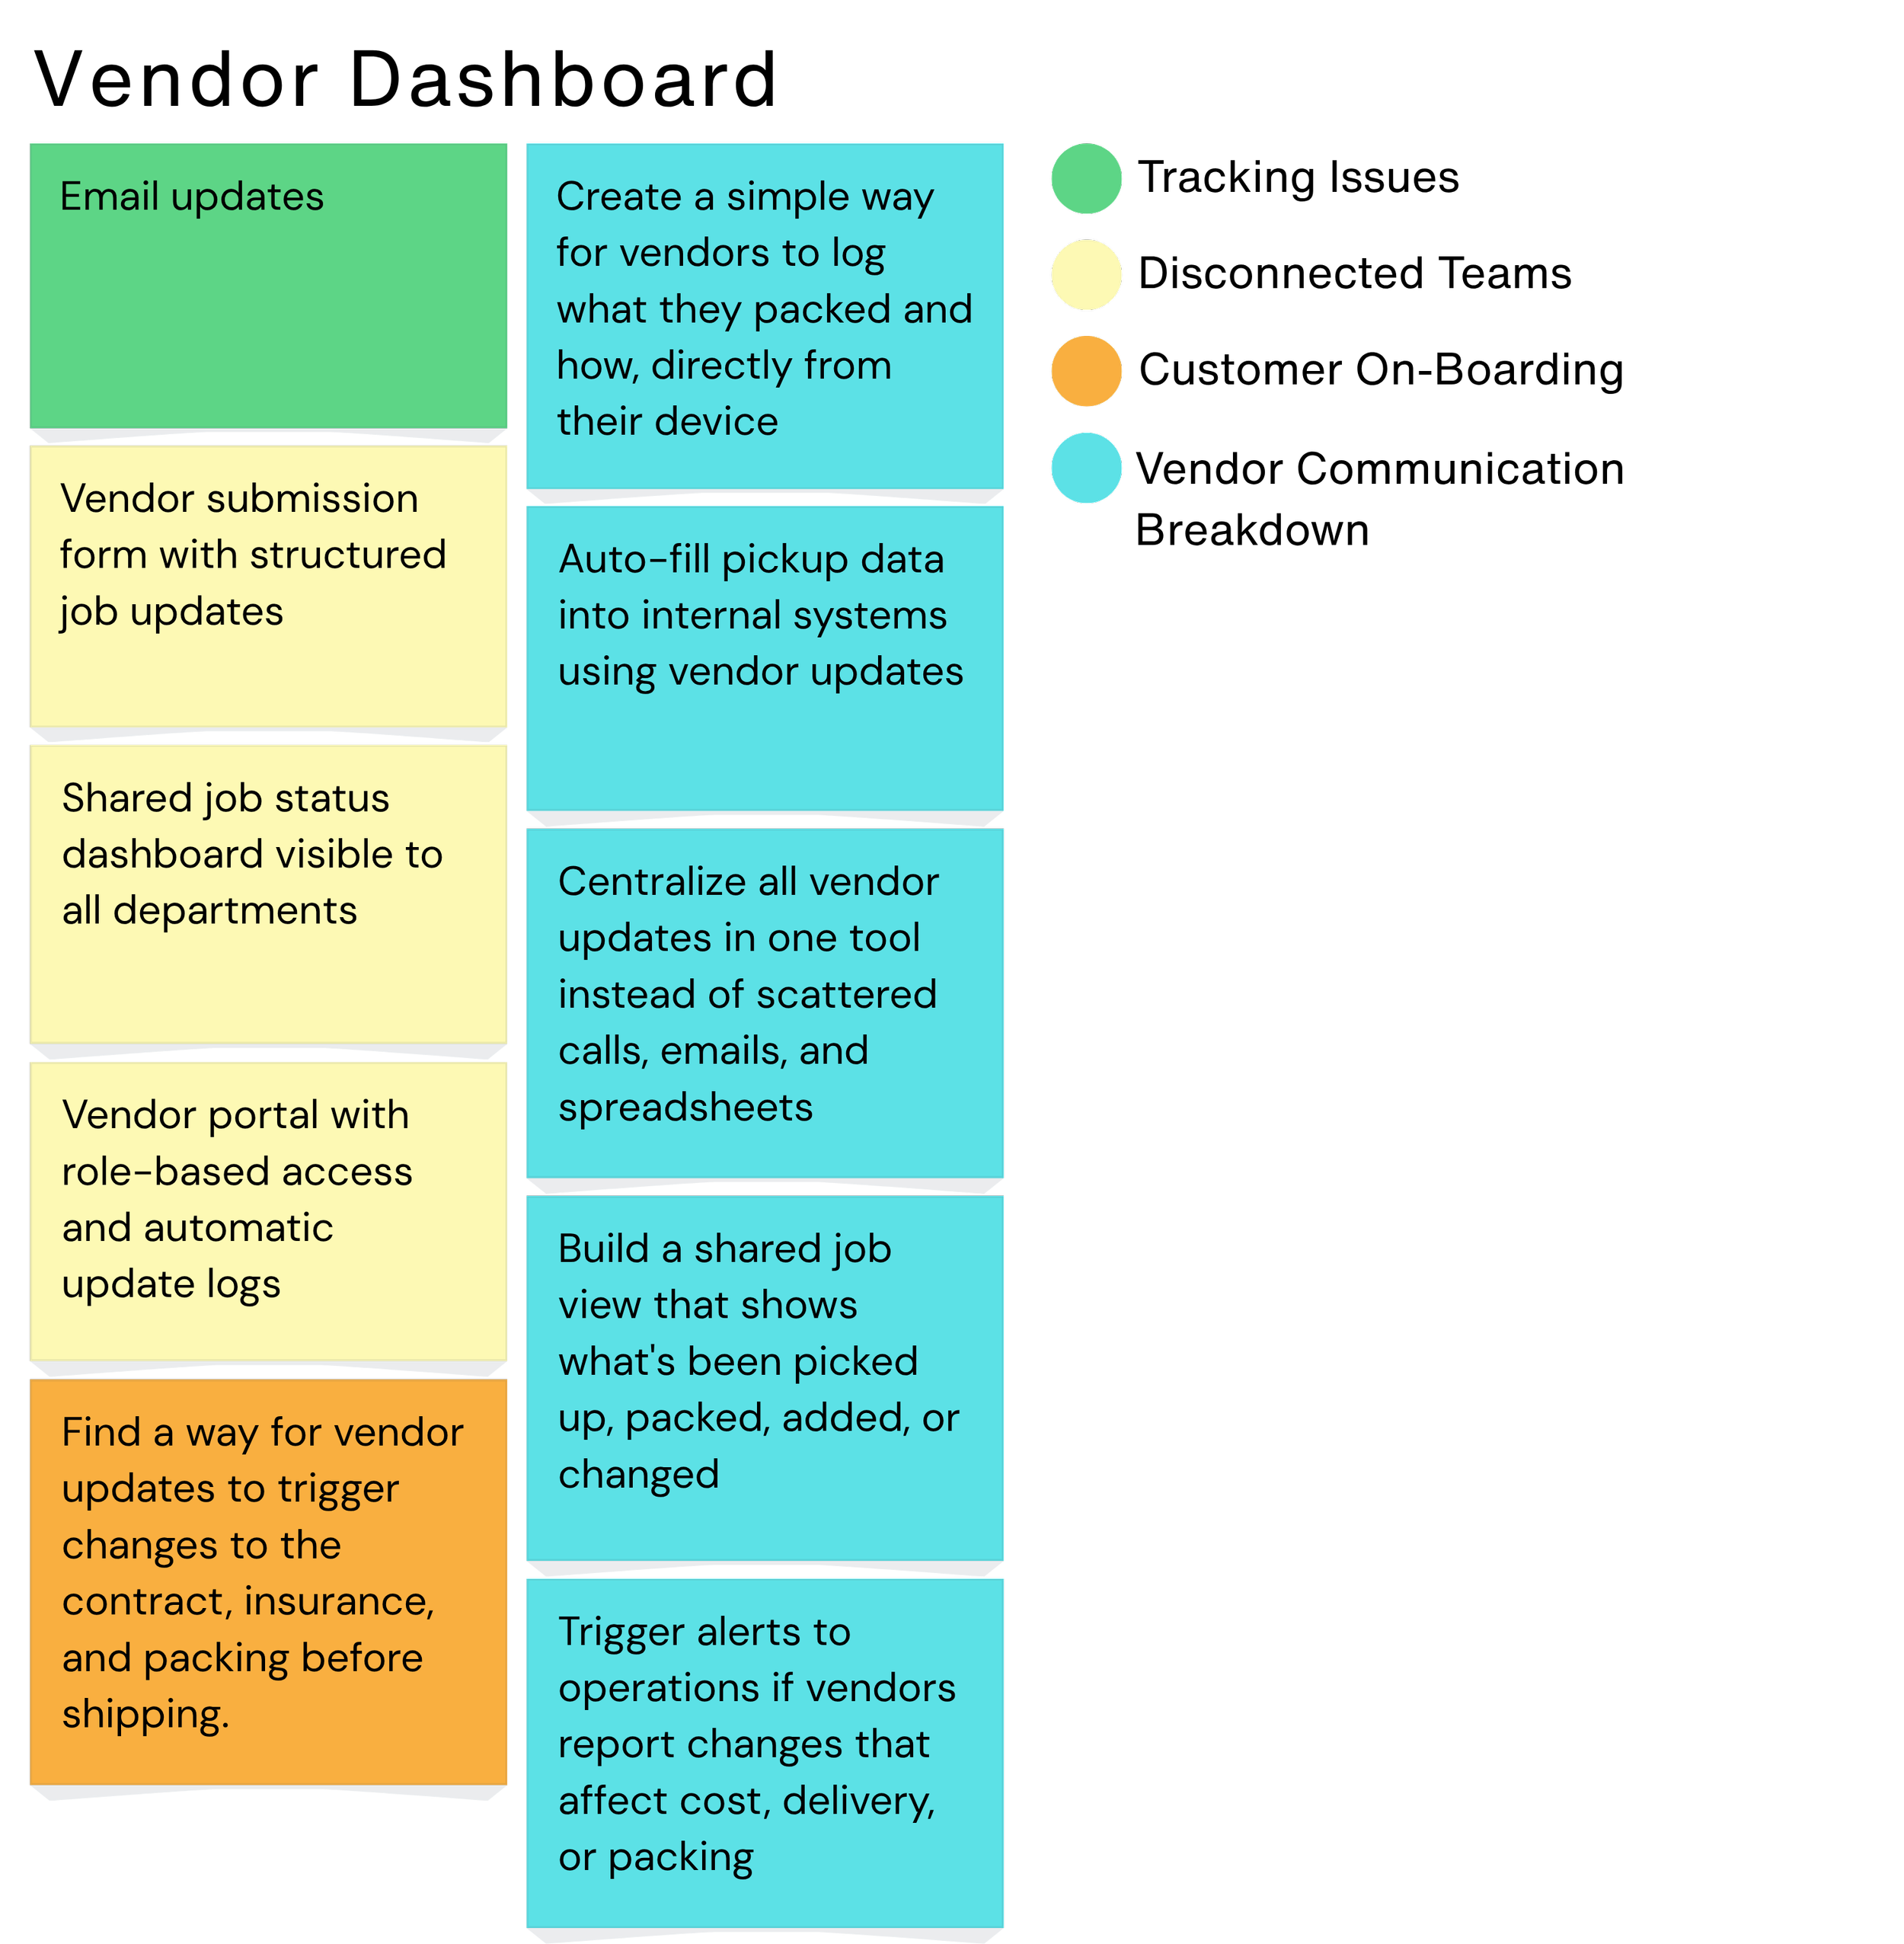
Group Brainstorm
I facilitated a cross-functional session bringing together Support, Ops, Sales, and Vendors to identify pain points and define solutions. The session used:
Dot voting to surface the highest-priority pain points across roles
Affinity mapping to group problems by underlying cause rather than symptom
Theme discovery to identify the shared infrastructure gap underneath all four pain clusters
Cross-silo problem breakdowns to expose where one team's workaround was creating another team's problem
How Might We
We grouped pain points into themes and reframed them into questions:
HMW help vendors update without delay?
HMW show customers shipment progress without needing support?
HMW reduce friction at final billing?
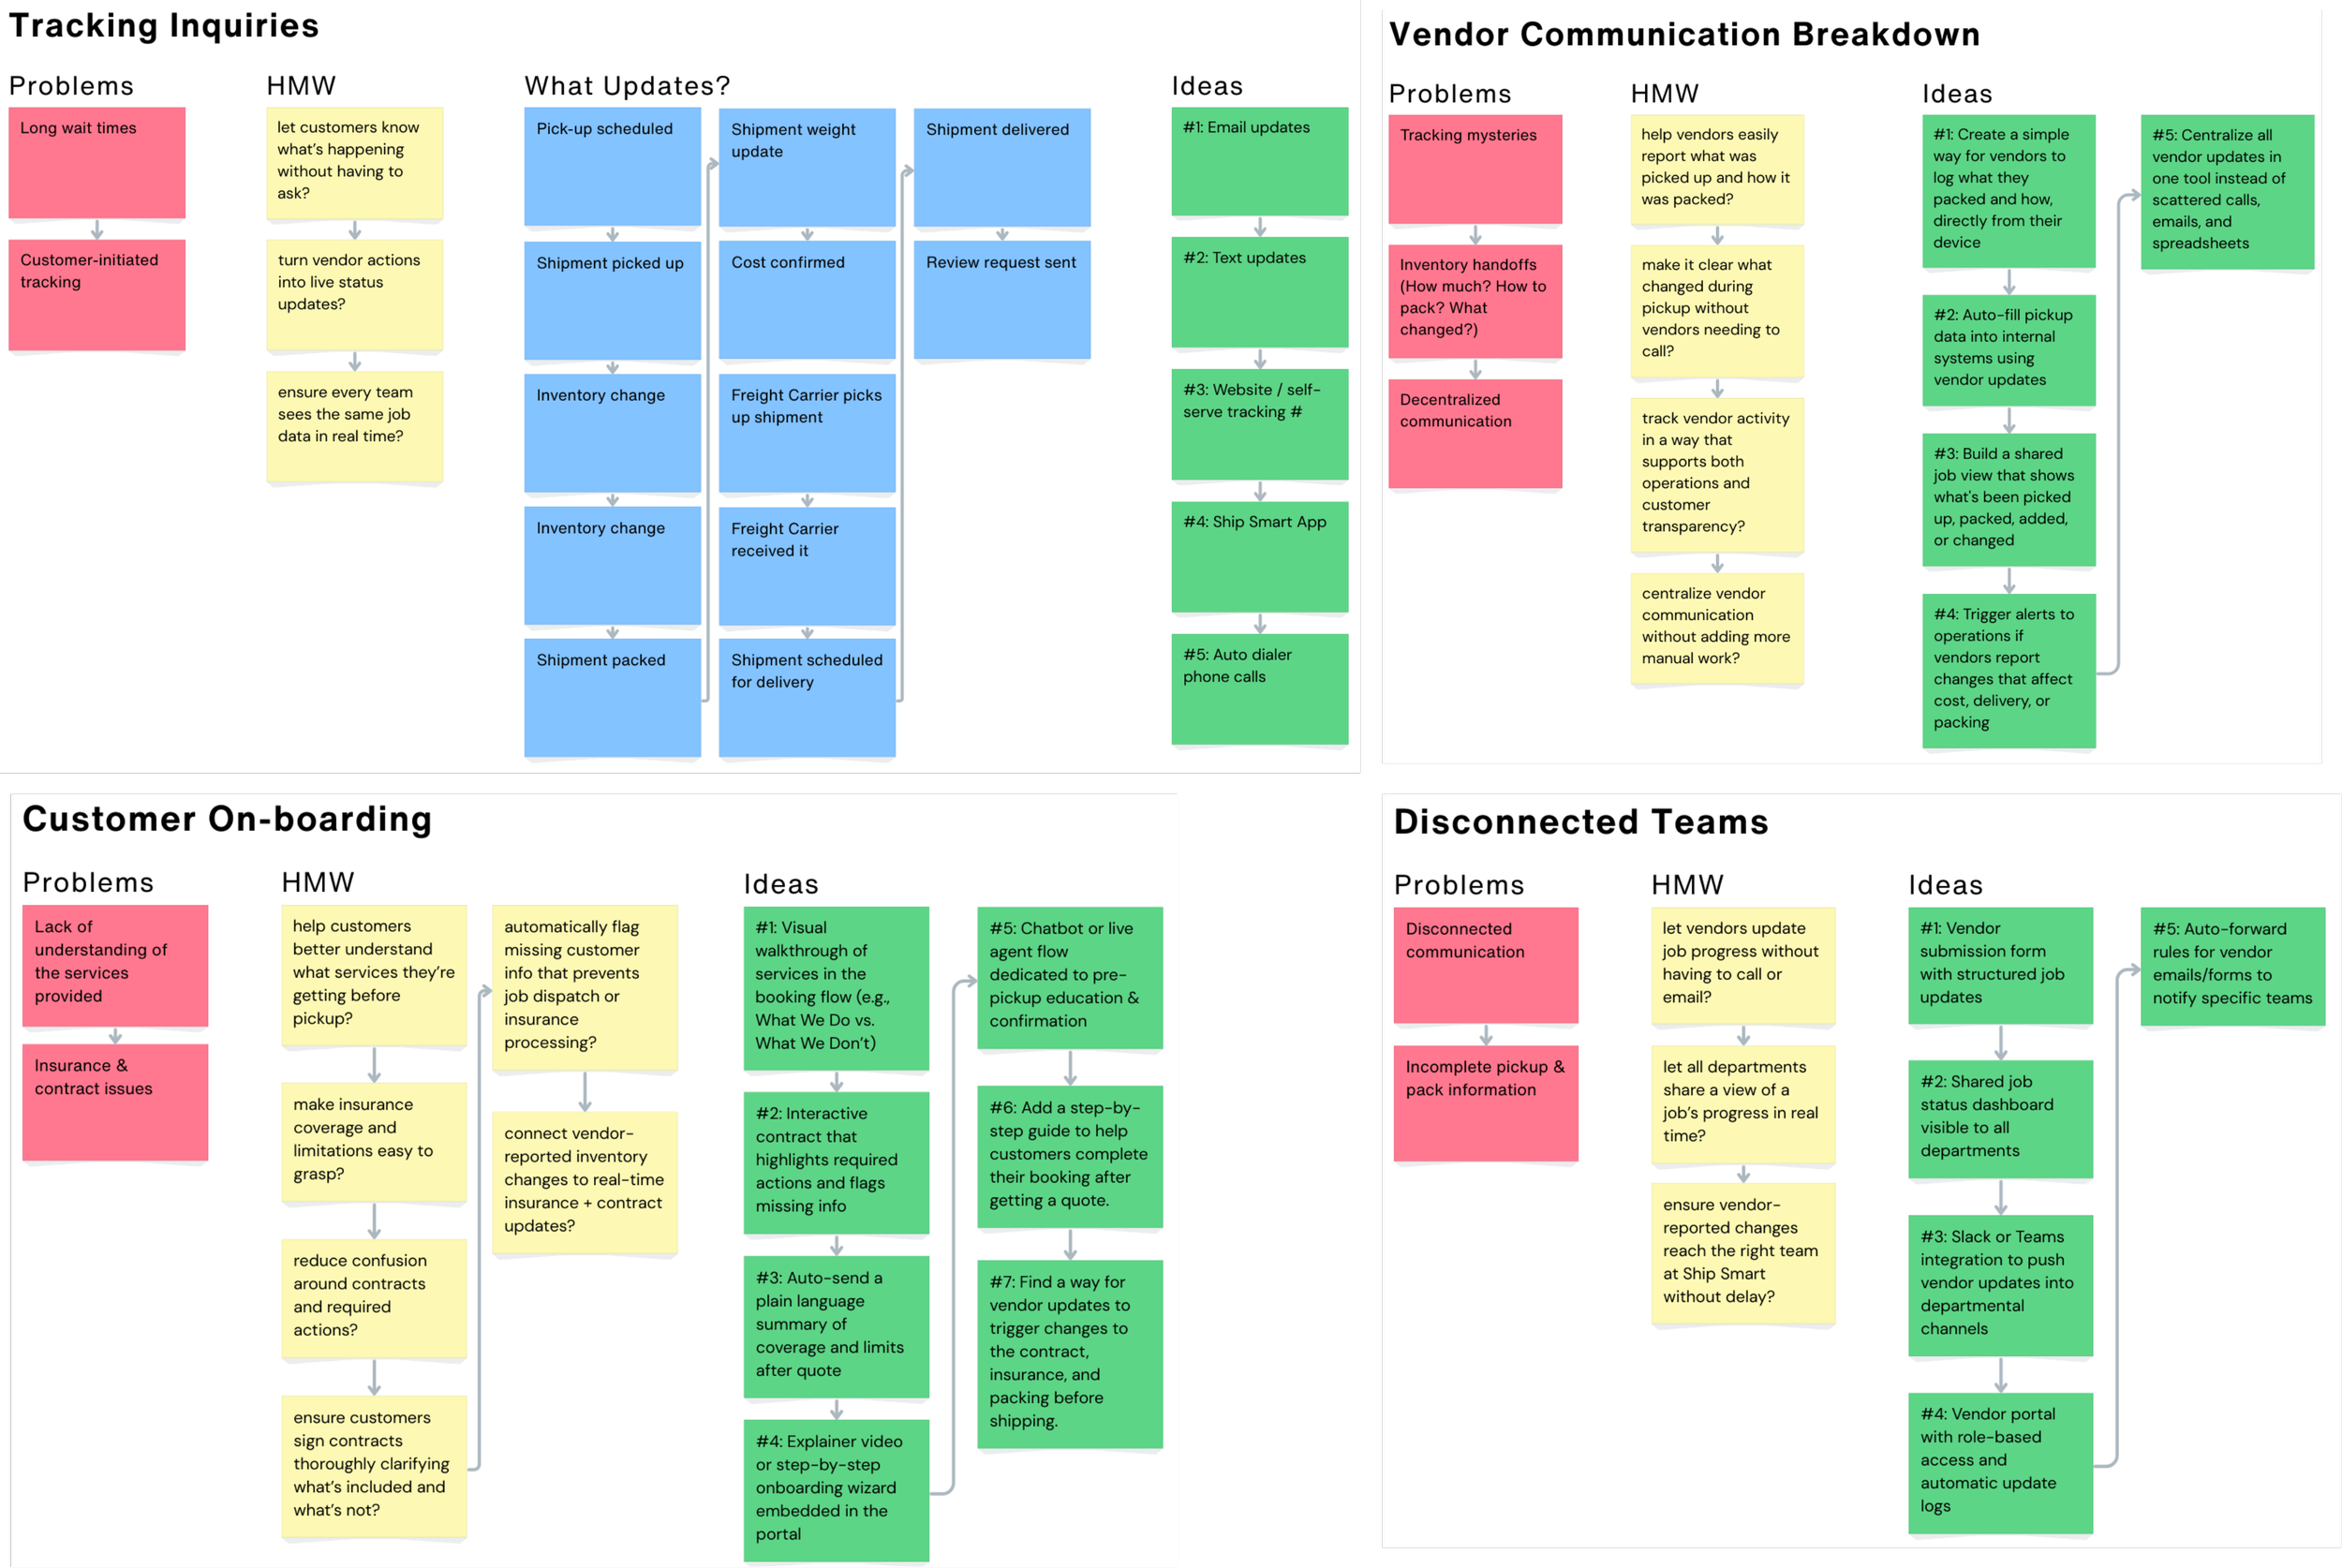
Solution Cluster
We grouped similar HMW solutions and found the missing piece: we needed a shared infrastructure to connect vendor progress with internal and customer communication. This insight became the backbone of Ship Smart Central, which includes:
Vendor Job Cards — structured input replacing email-thread coordination
Discrepancy Alerts — a role-based accountability mechanism for pickup variances
Triggered Emails — automated customer communication fired by lifecycle state change
Strategy & Ideation
The original brief was narrow: reduce support load and improve customer confidence. Through collaborative discovery journey mapping, service blueprinting, and cross-functional facilitation, the real scope became clear.
The problem wasn't communication. It was state modeling. There was no shared system to define what a shipment's status meant, who owned it at each stage, or what should happen when it changed. Until those questions were answered at the infrastructure level, any communication layer built on top would be unreliable.
The strategy shifted from designing better notifications to designing the underlying system of record that would enable reliable notifications.
What Made This Hard
The business believed it had a communication problem. Customers lacked updates. Support was overwhelmed. Vendors were inconsistent. The obvious solution was better messaging.
The real issue was deeper. Each team used different language for the same shipment state. Ownership was unclear. Workarounds existed everywhere but no shared model connected them. Every proposed solution, better emails, more staff, automated reminders, was a workaround built on top of broken state logic.
The challenge wasn't designing the system. It was aligning four teams with different priorities and mental models around a shared understanding of how the system should behave. The challenge wasn't designing better communication. It was redefining how the business understood and operated around shipment state.
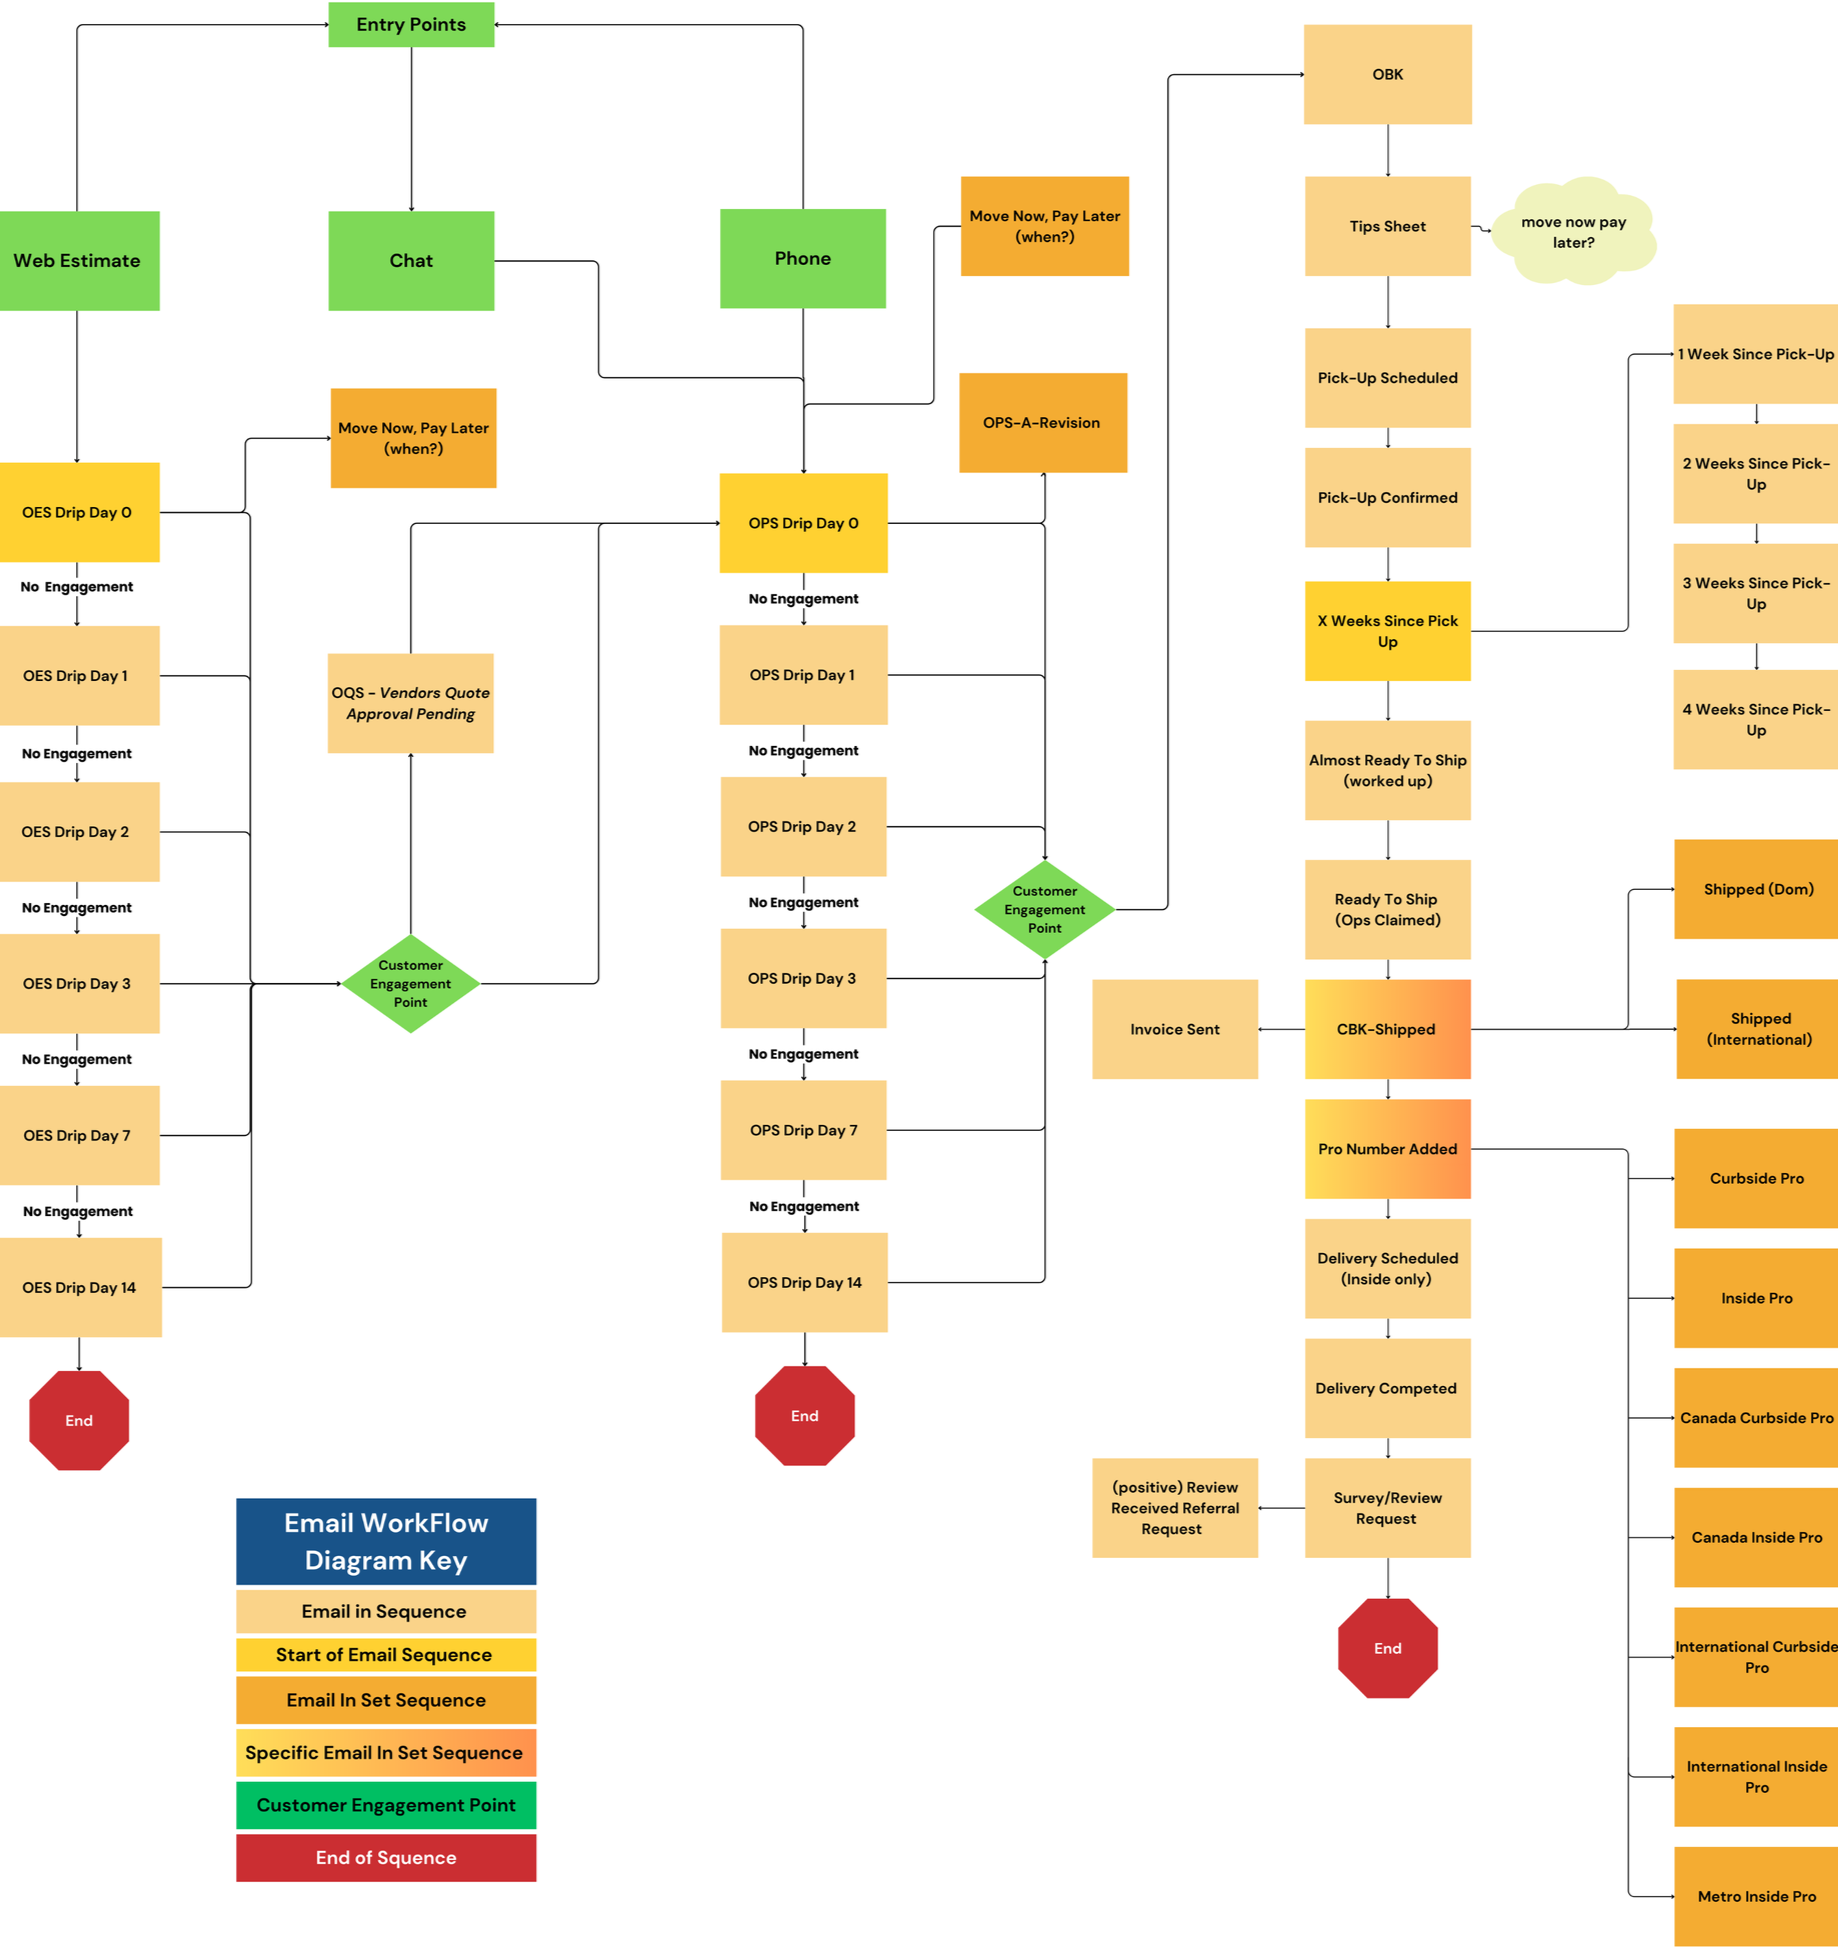
Touchpoint Mapping
I mapped every email touch point and template from estimate to delivery, connecting each customer communication to the specific lifecycle state change that should trigger it. This replaced manual follow-up decisions with a structured automation layer that requires no human judgment to decide whether to send an update.
The result was a SendGrid-based email workflow covering 23 lifecycle trigger states across three parallel tracks: customer updates, vendor accountability communications, and internal ops alerts.
Final Design
The final design is not six separate tools. It is one system expressed across multiple role-specific surfaces, all driven by a shared lifecycle data model. The following views show how one system adapts across roles, each surface driven by the same lifecycle data and designed for a different job to be done.
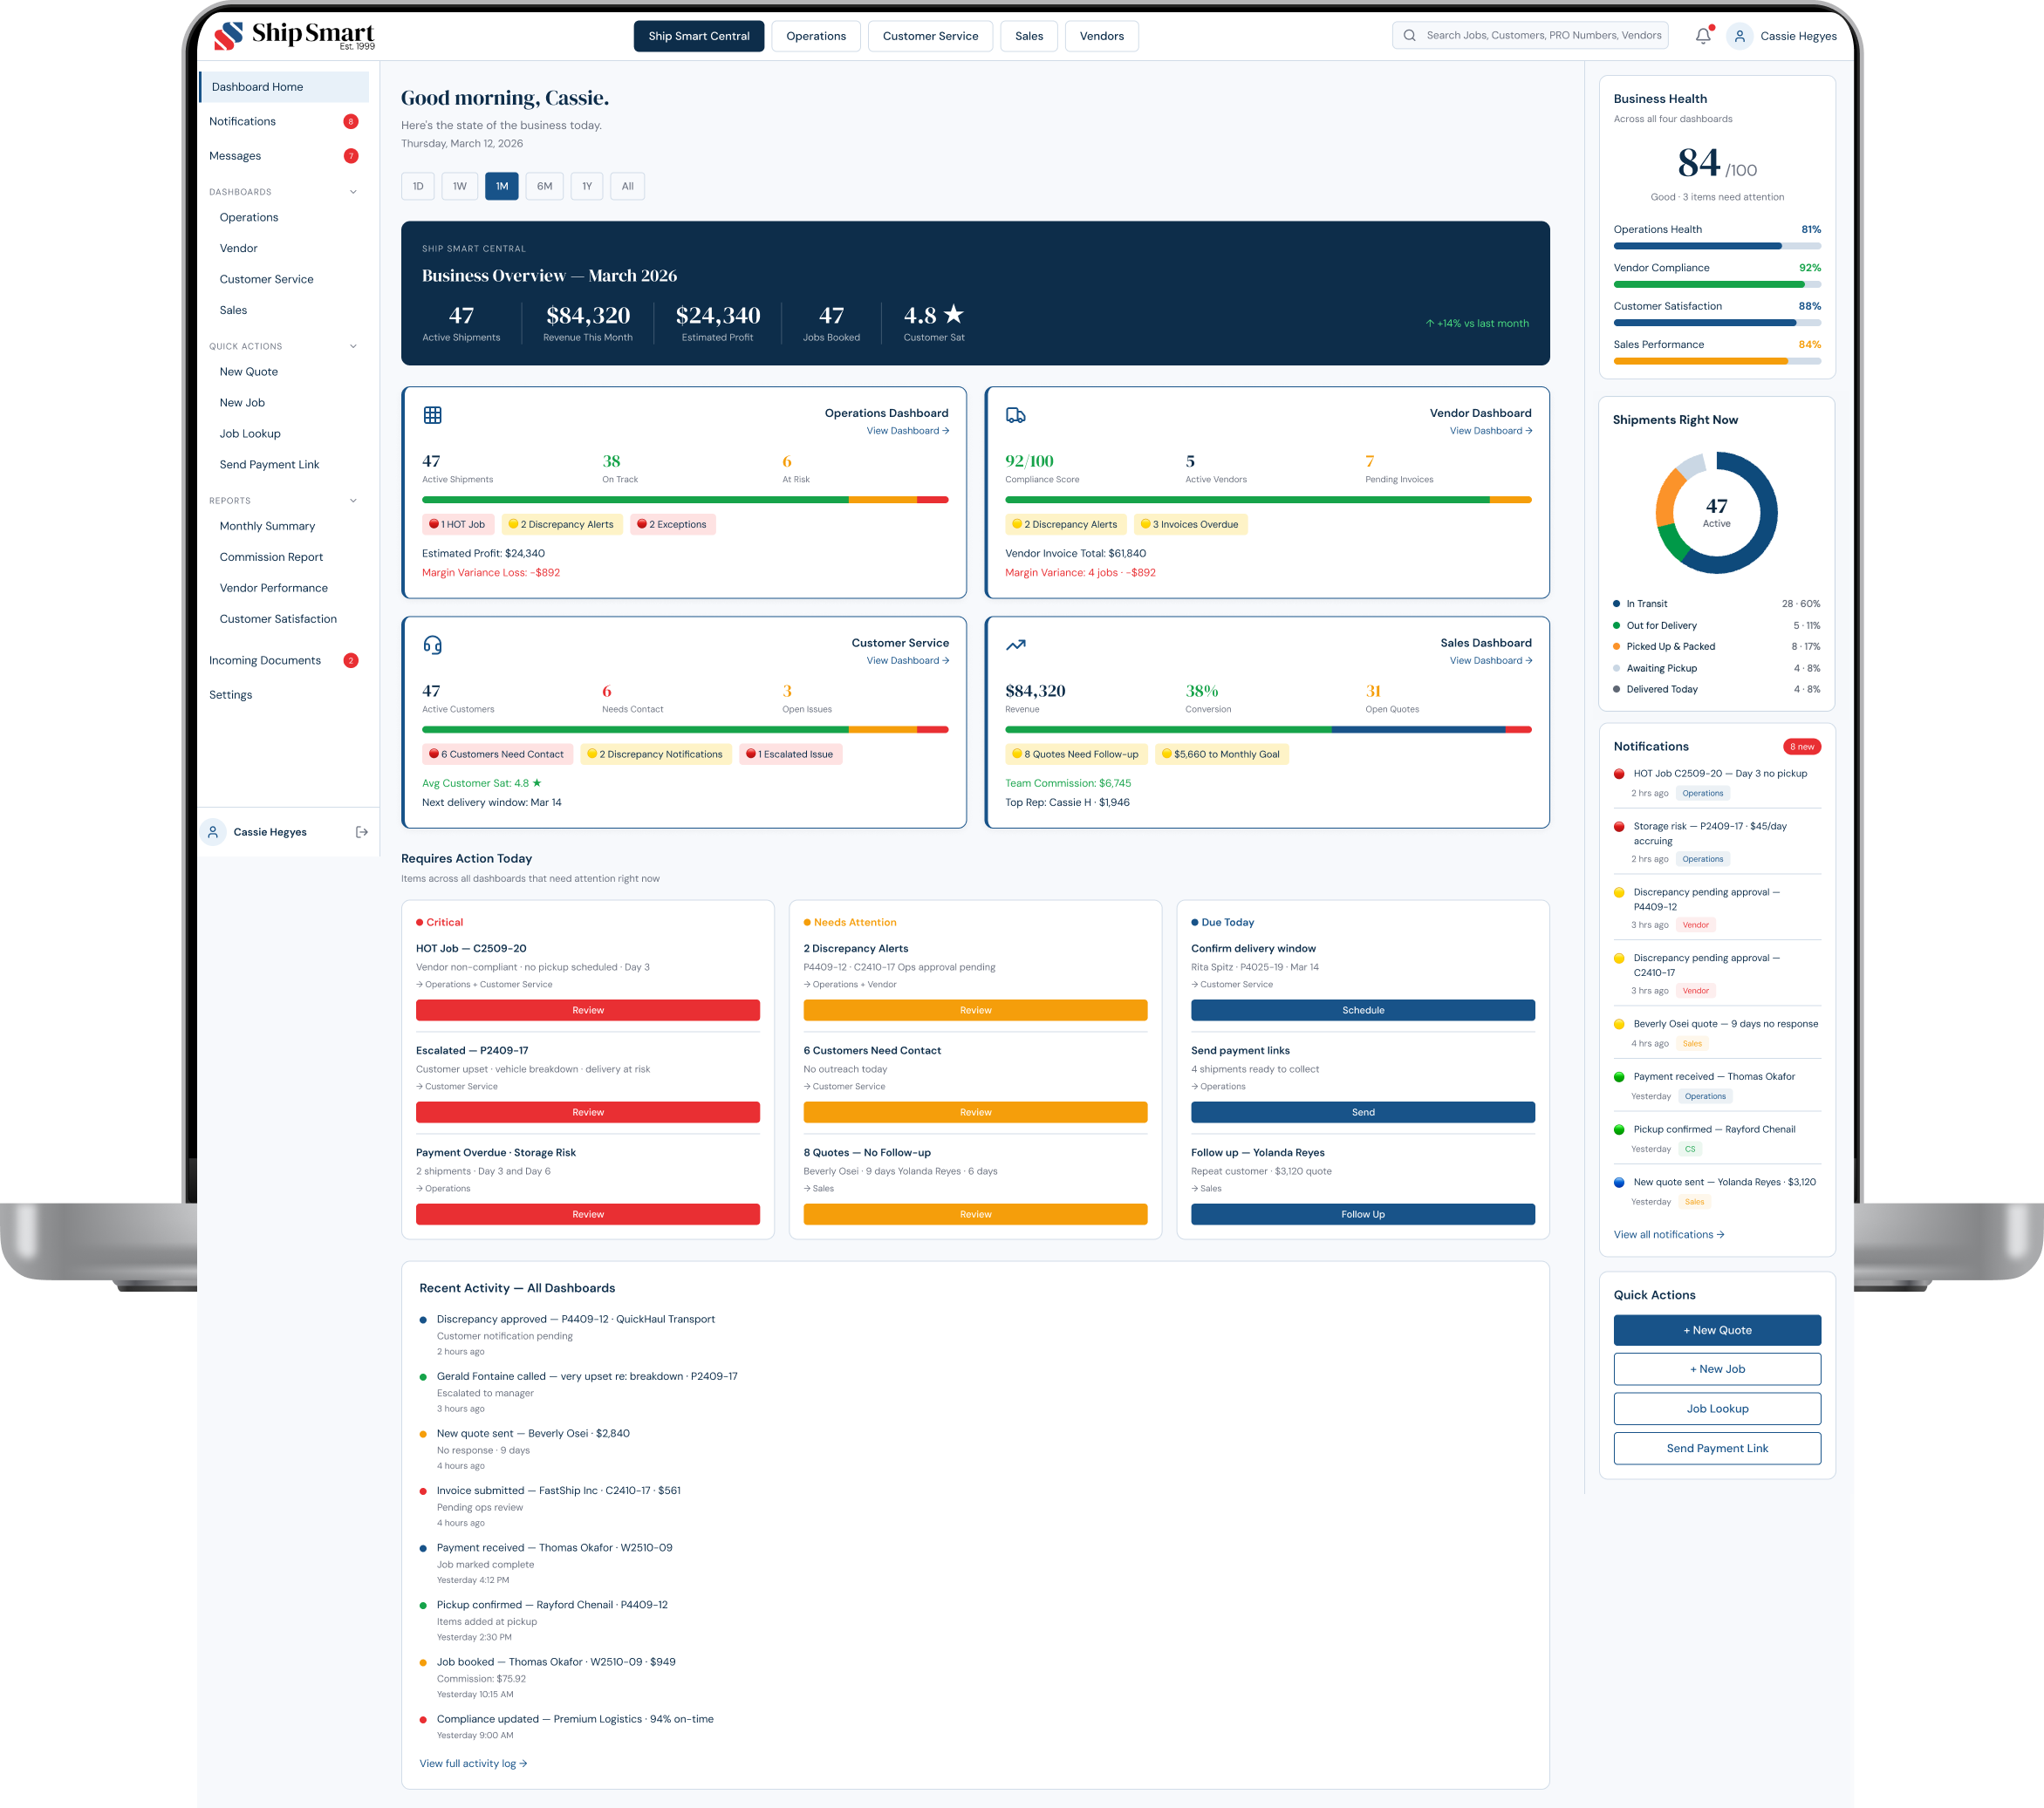
Ship Smart Central — Main Dashboard
The master dashboard provides a real-time view of overall business health across all roles, consolidating Business Health (84/100), four role dashboards, Requires Action Today alerts, and live operational activity.
The system's central visibility layer — shared understanding of system state across leadership and operations.
Operations Dashboard — Lifecycle State Management
Operations views every shipment through a lifecycle lens: margin risk, vendor compliance, discrepancy alerts, exception status, and payment collection, all from a single surface.
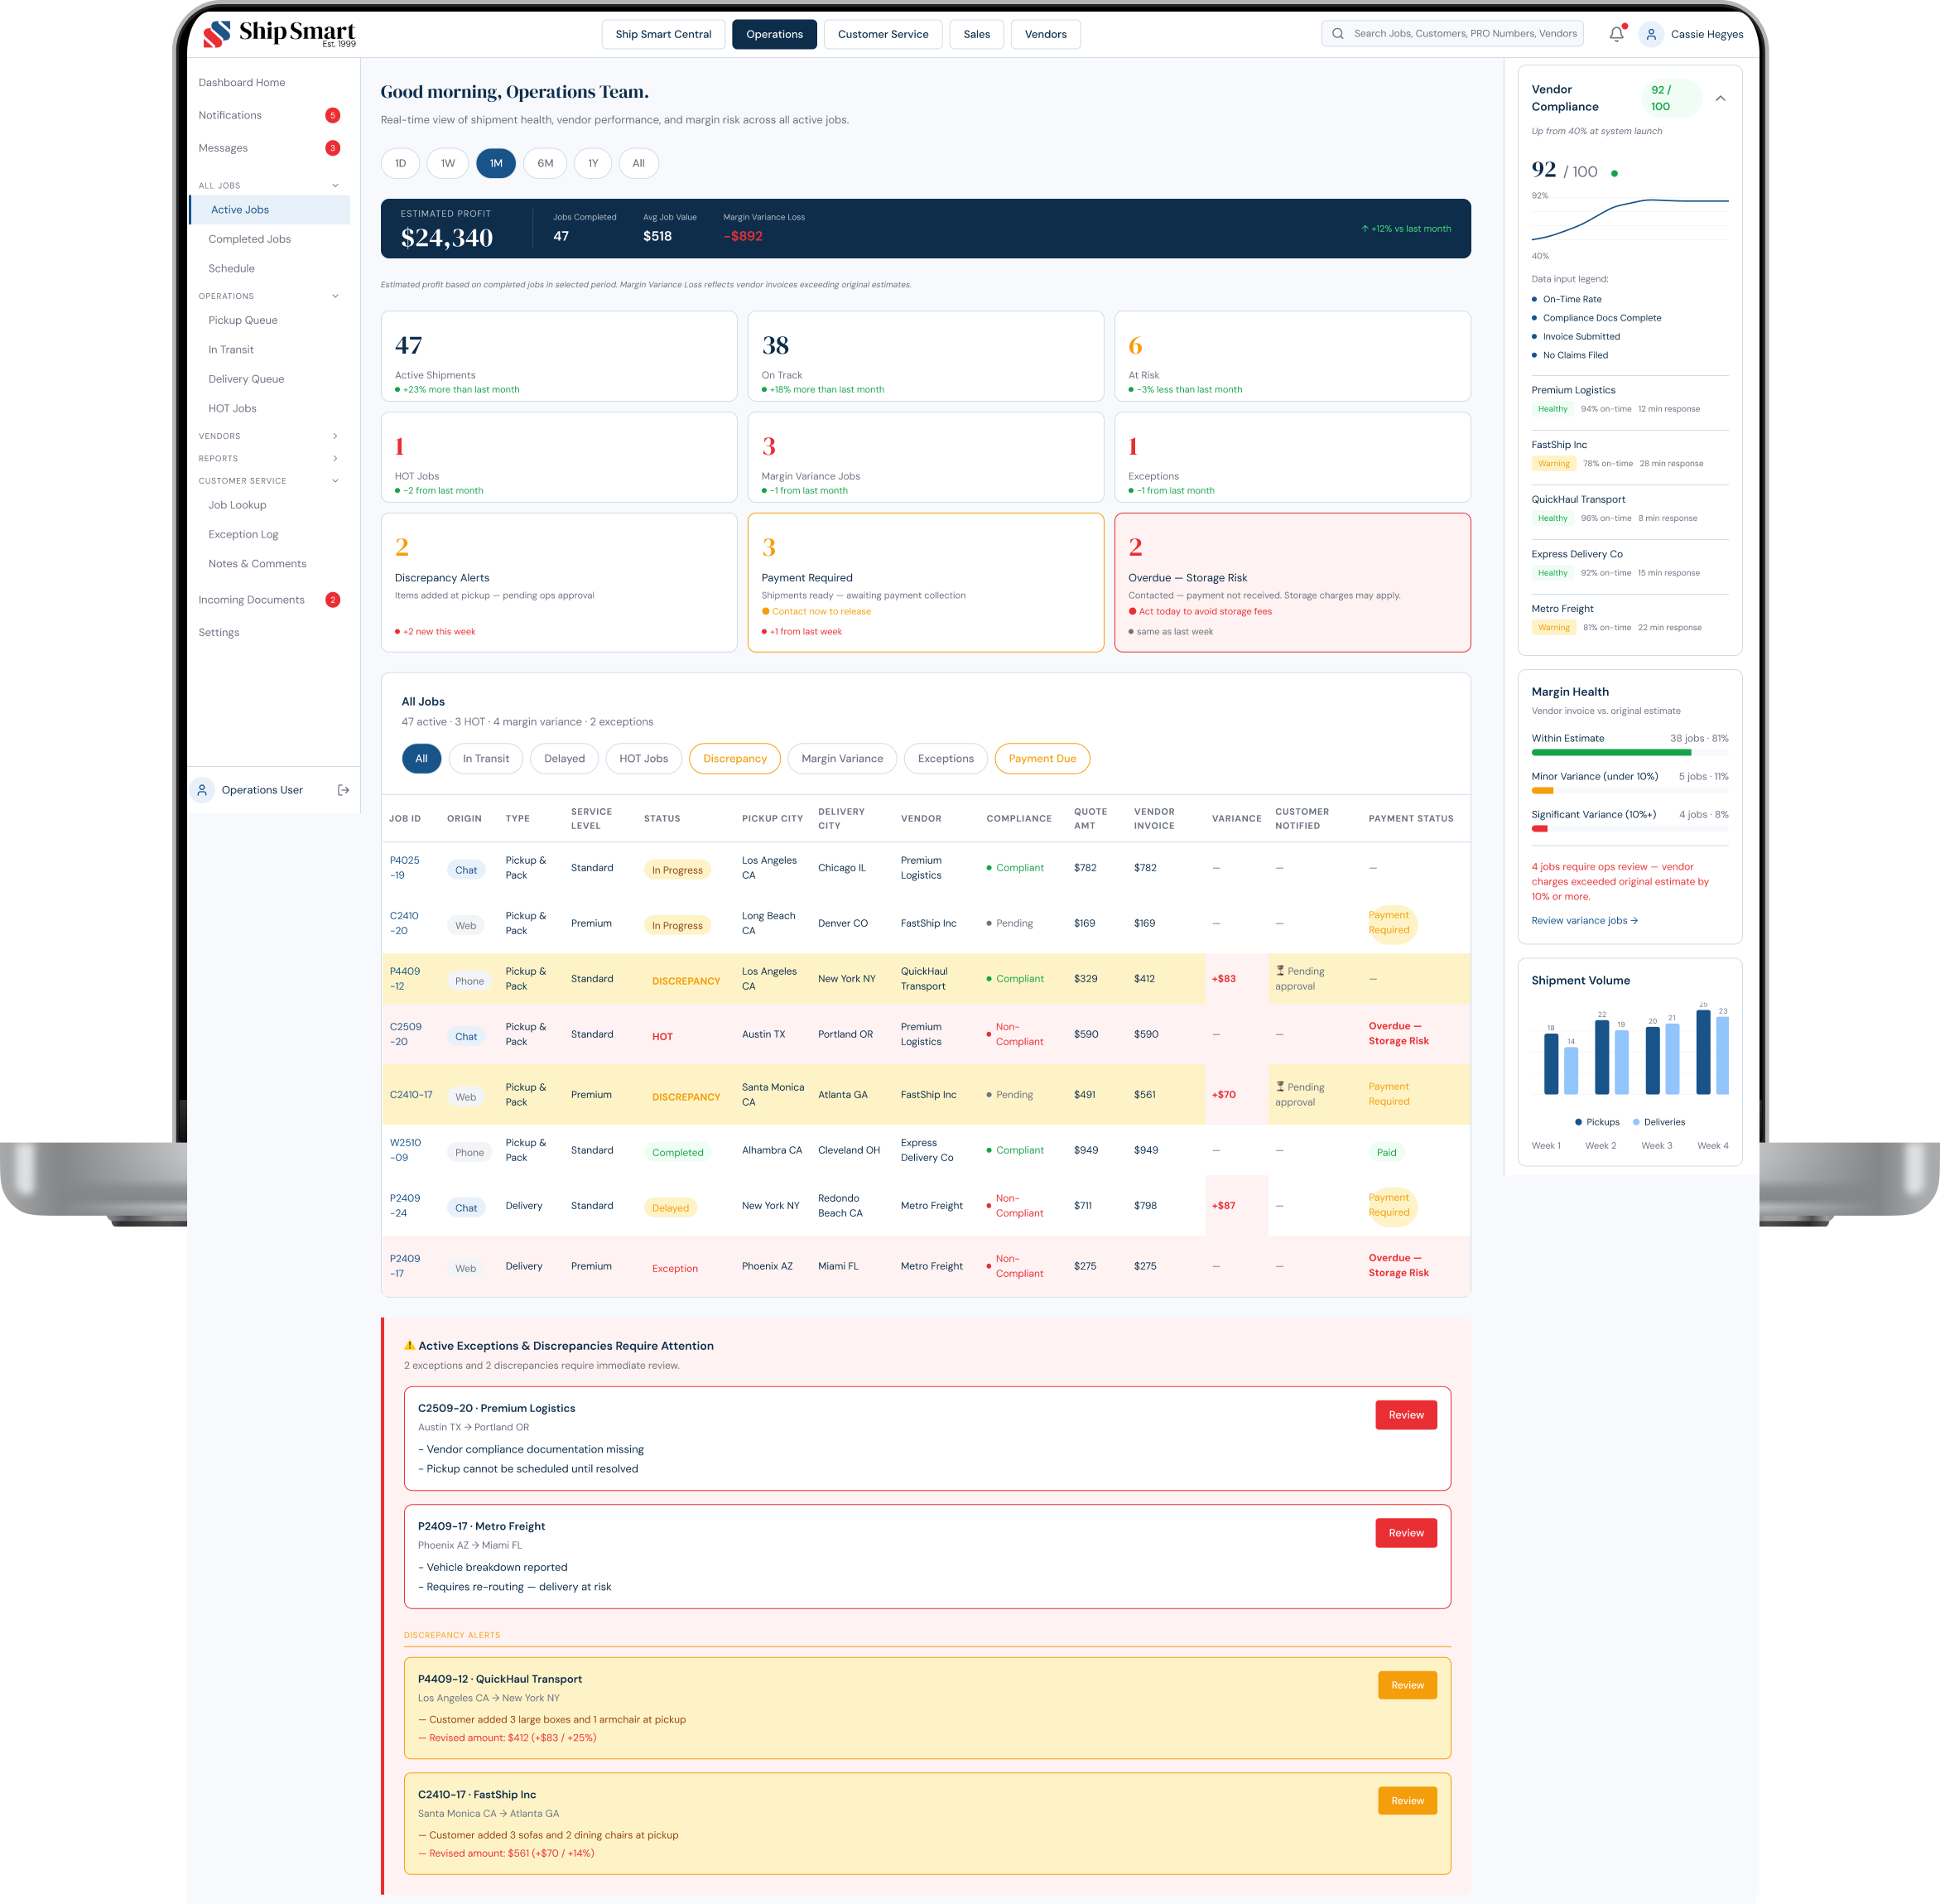
The dashboard adapts to multiple operational states, allowing teams to move from monitoring to decision-making without switching tools.
Operations — Vendor Non-Compliance (HOT Jobs)
The HOT Jobs view isolates shipments blocked by vendor non-compliance. Example: C2509-20 shows a missing COI preventing pickup, along with a compliance checklist, timeline, and three escalation actions available directly in-panel.
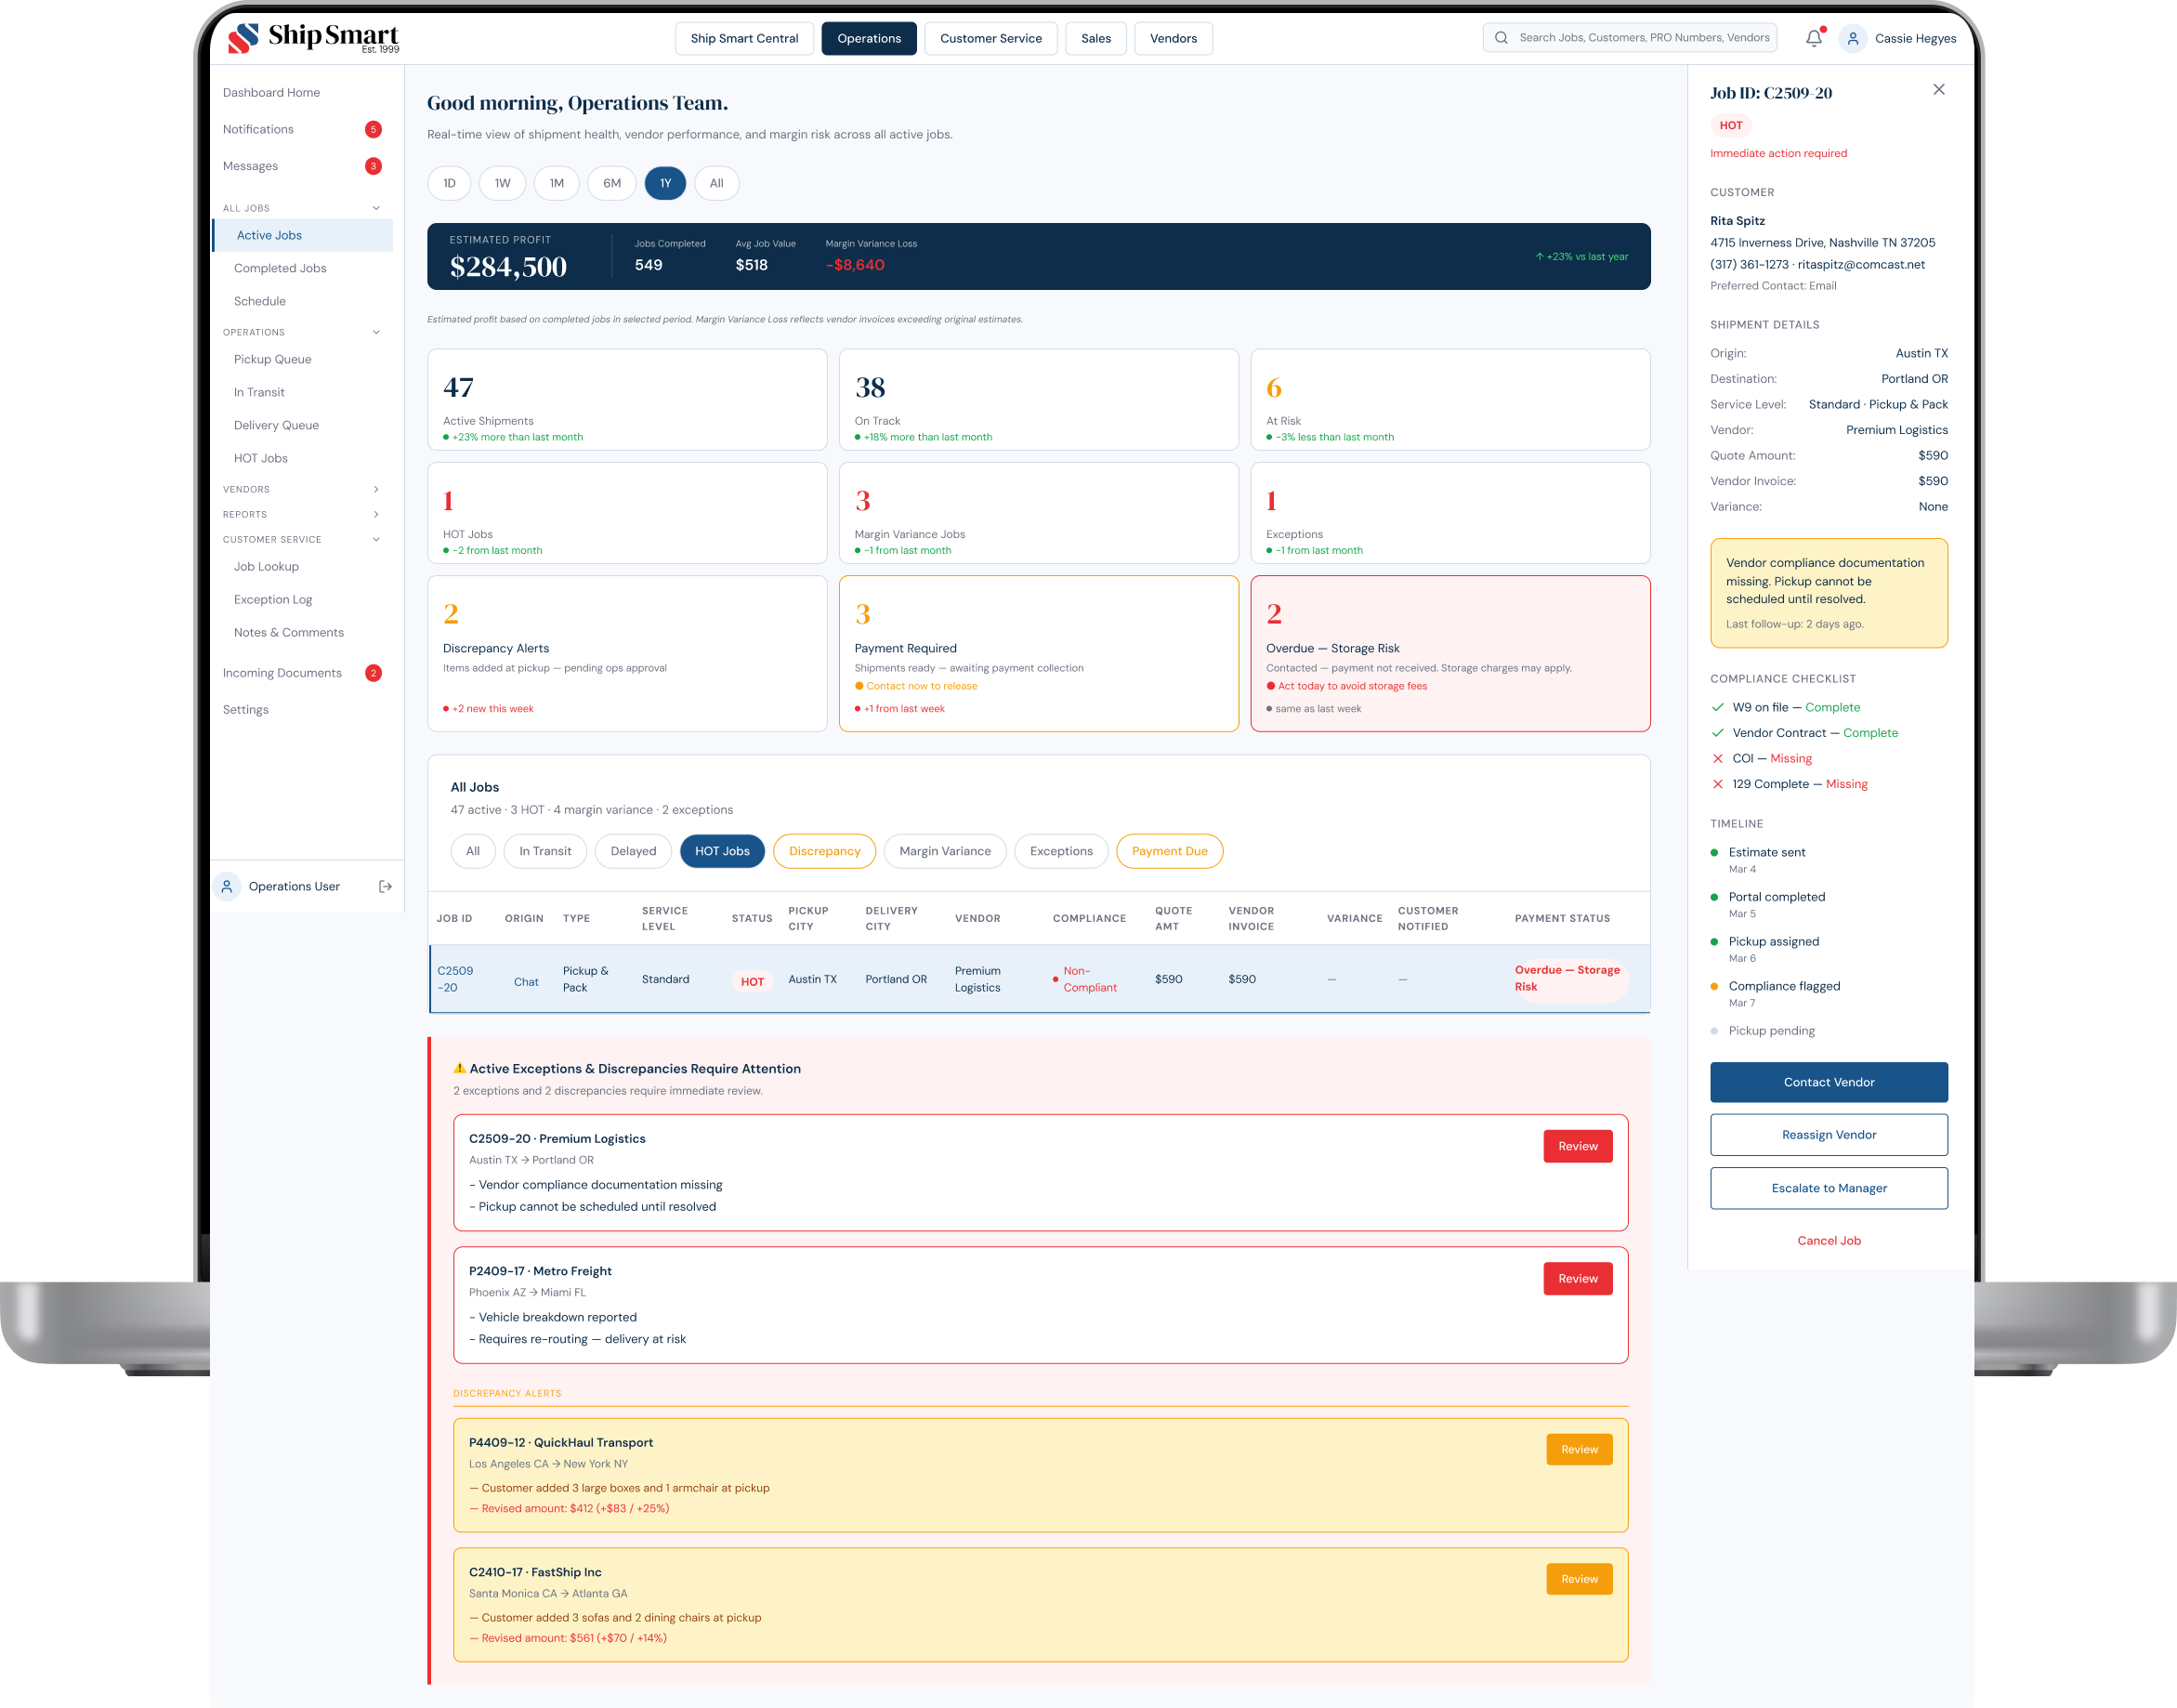
Turns vendor delays from reactive follow-up into a structured resolution workflow.
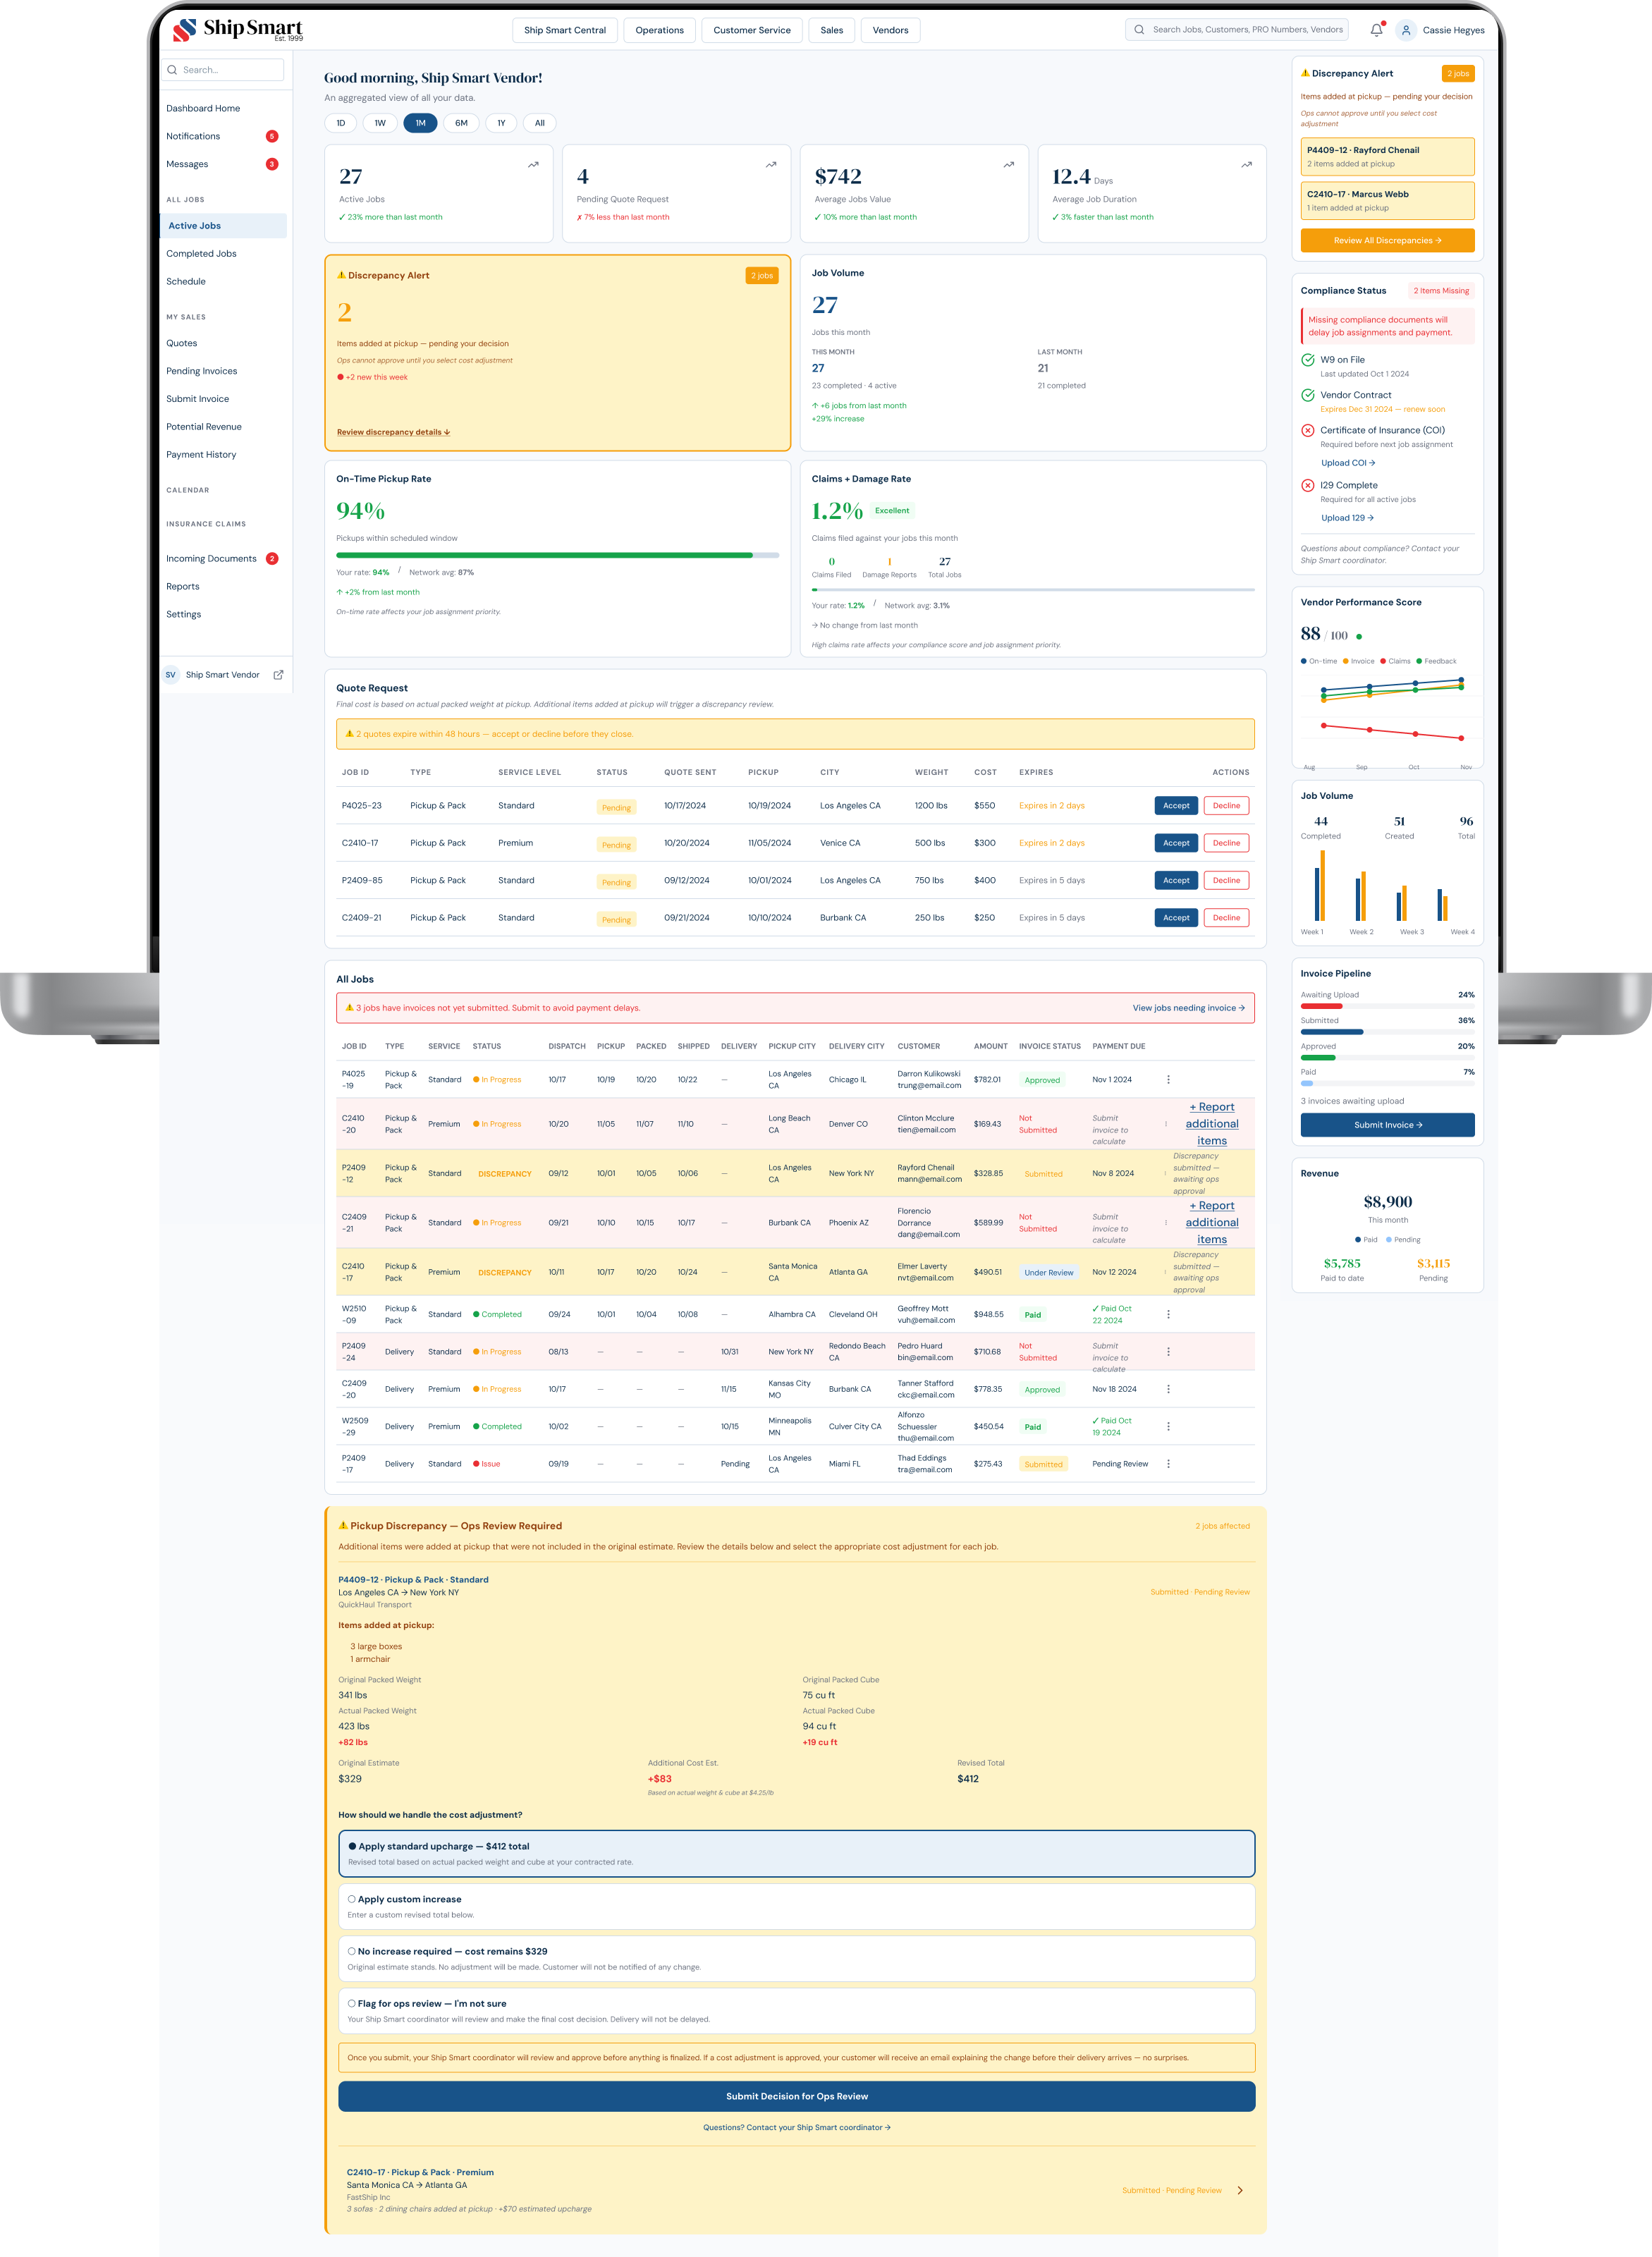
Operations — Discrepancy Approval
P4409-12 shows a discrepancy panel comparing estimated vs. actual shipment details: 341 lbs to 423 lbs, $329 to $412 revised amount. A single approval action triggers the customer notification, lifecycle state transition, and all downstream updates.
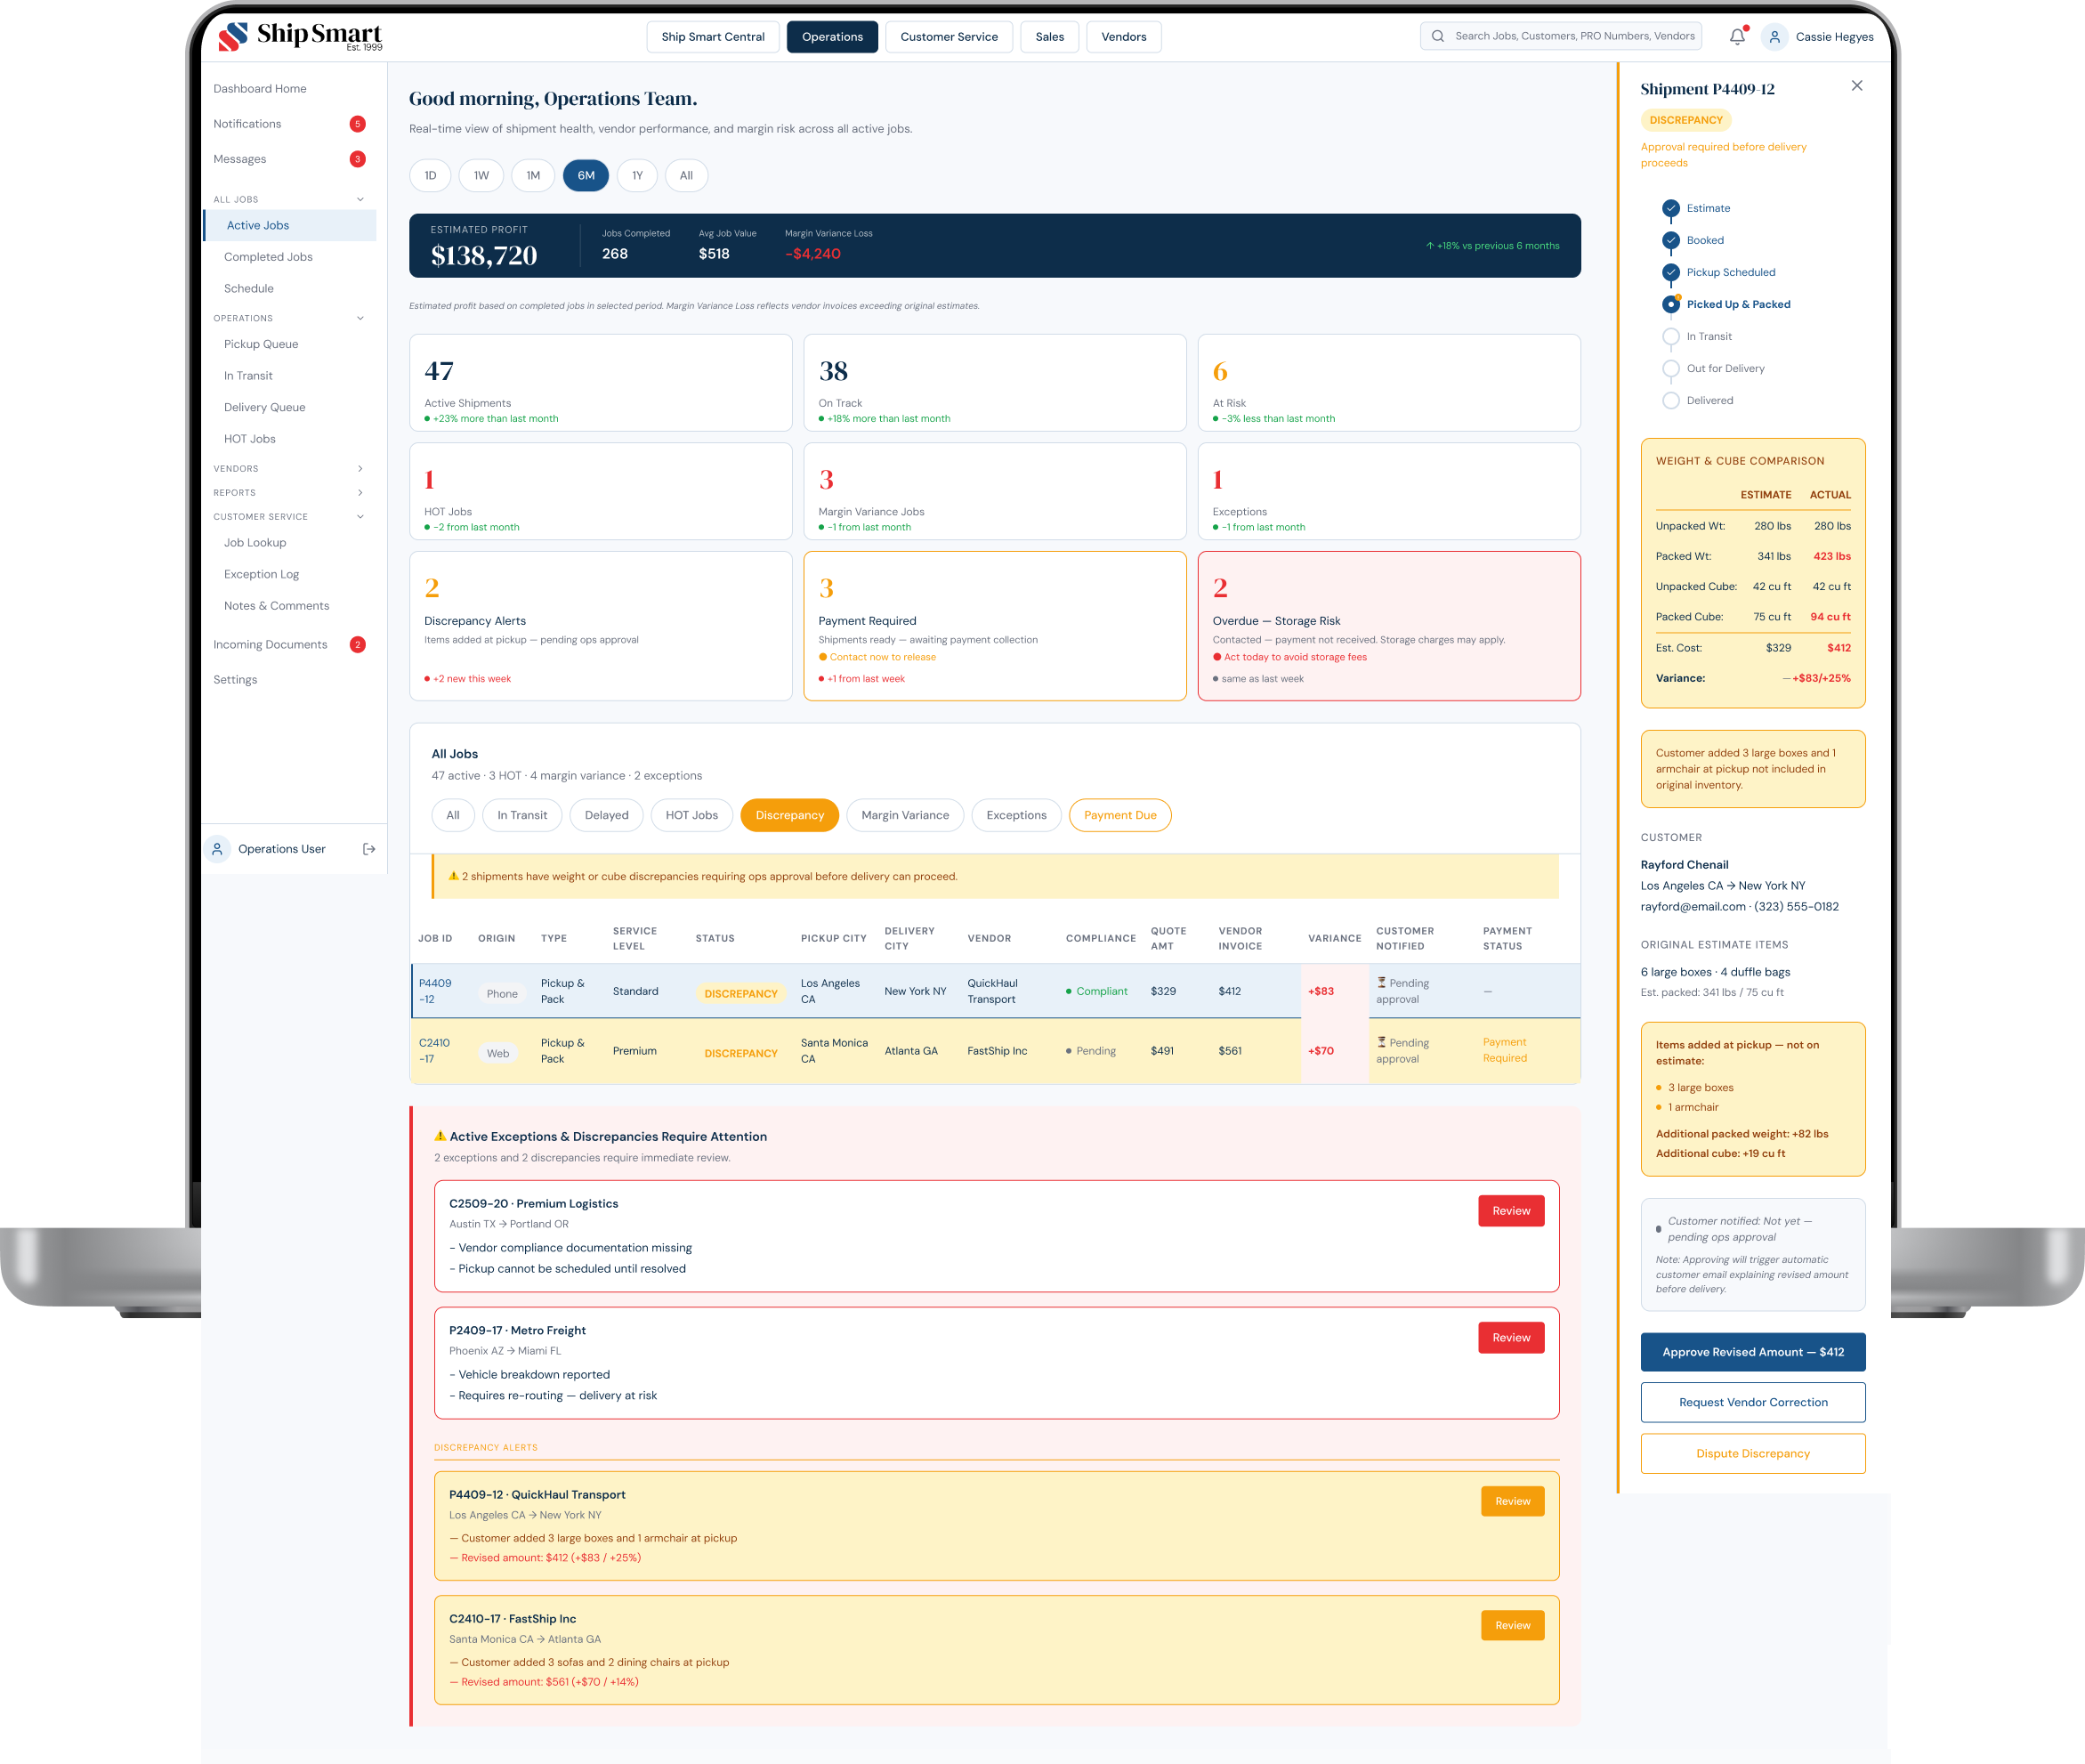
No manual coordination required.
Operations — Payment Due (Revenue Protection)
When payment has not been collected, Operations shifts into a revenue protection state with direct actions per row, real-time storage accrual tracking ($45/day), and 7-day cost projections.
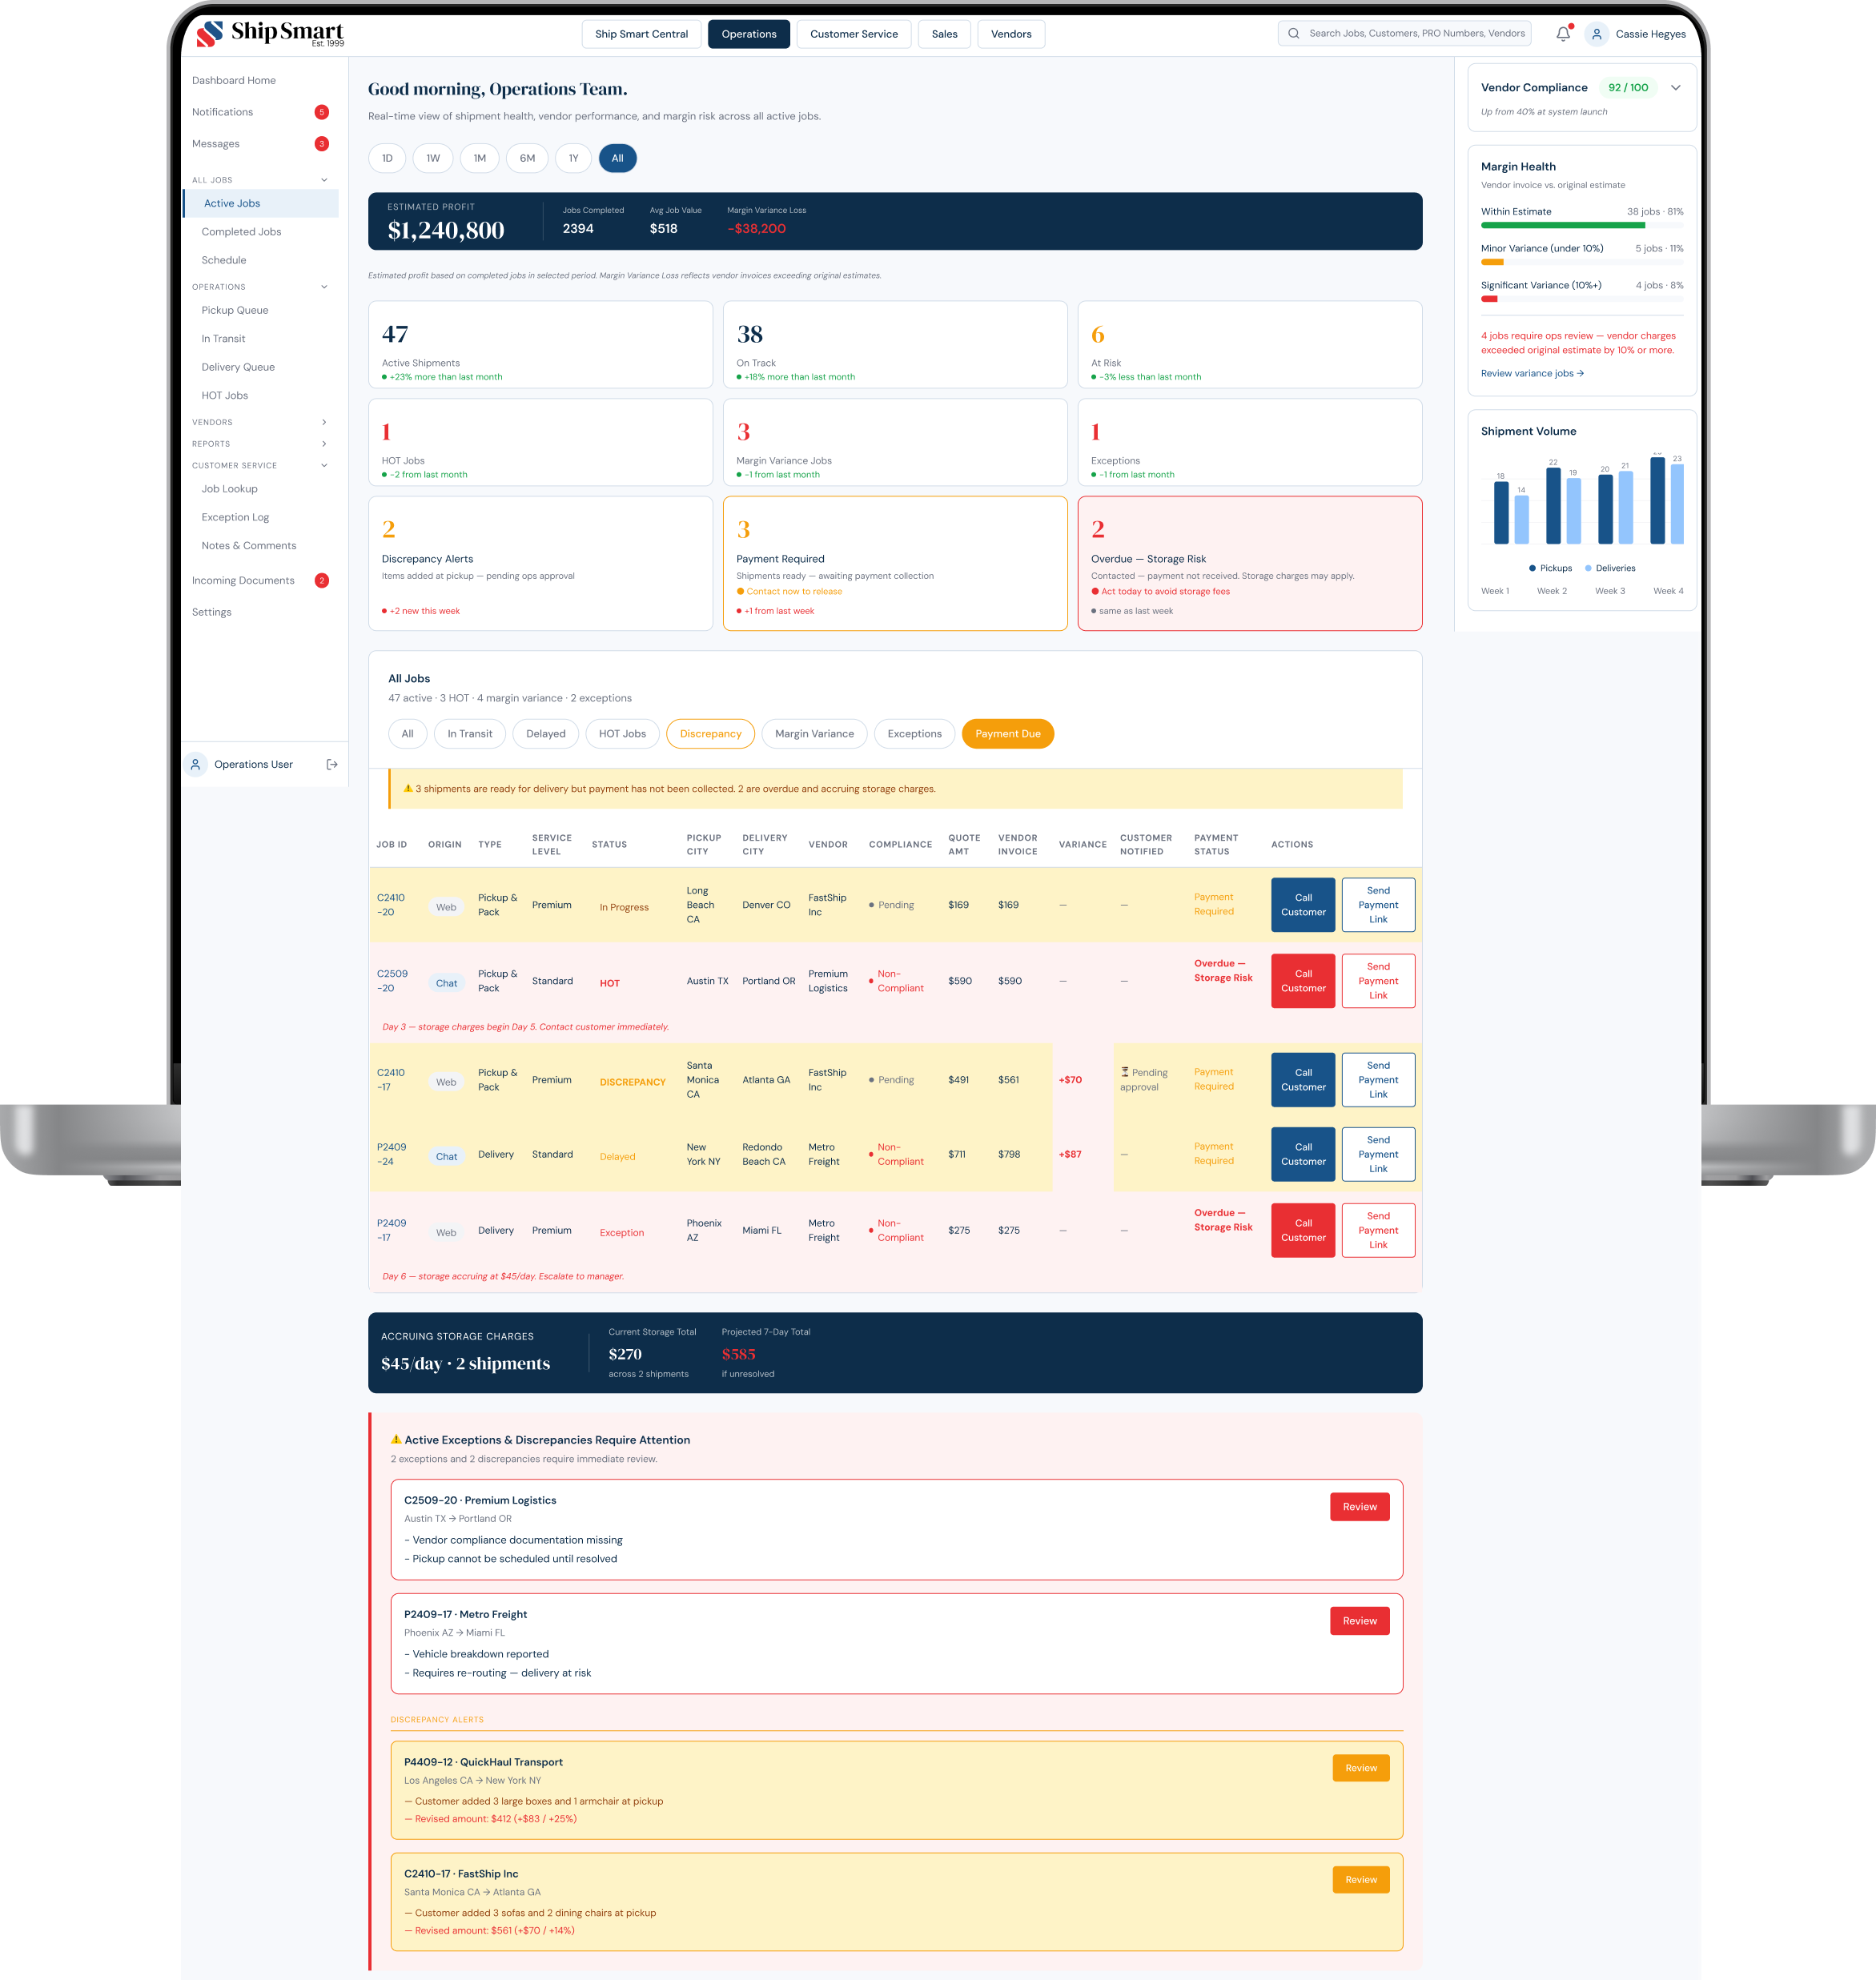
Transforms payment delays into visible, actionable system states rather than hidden operational risk.
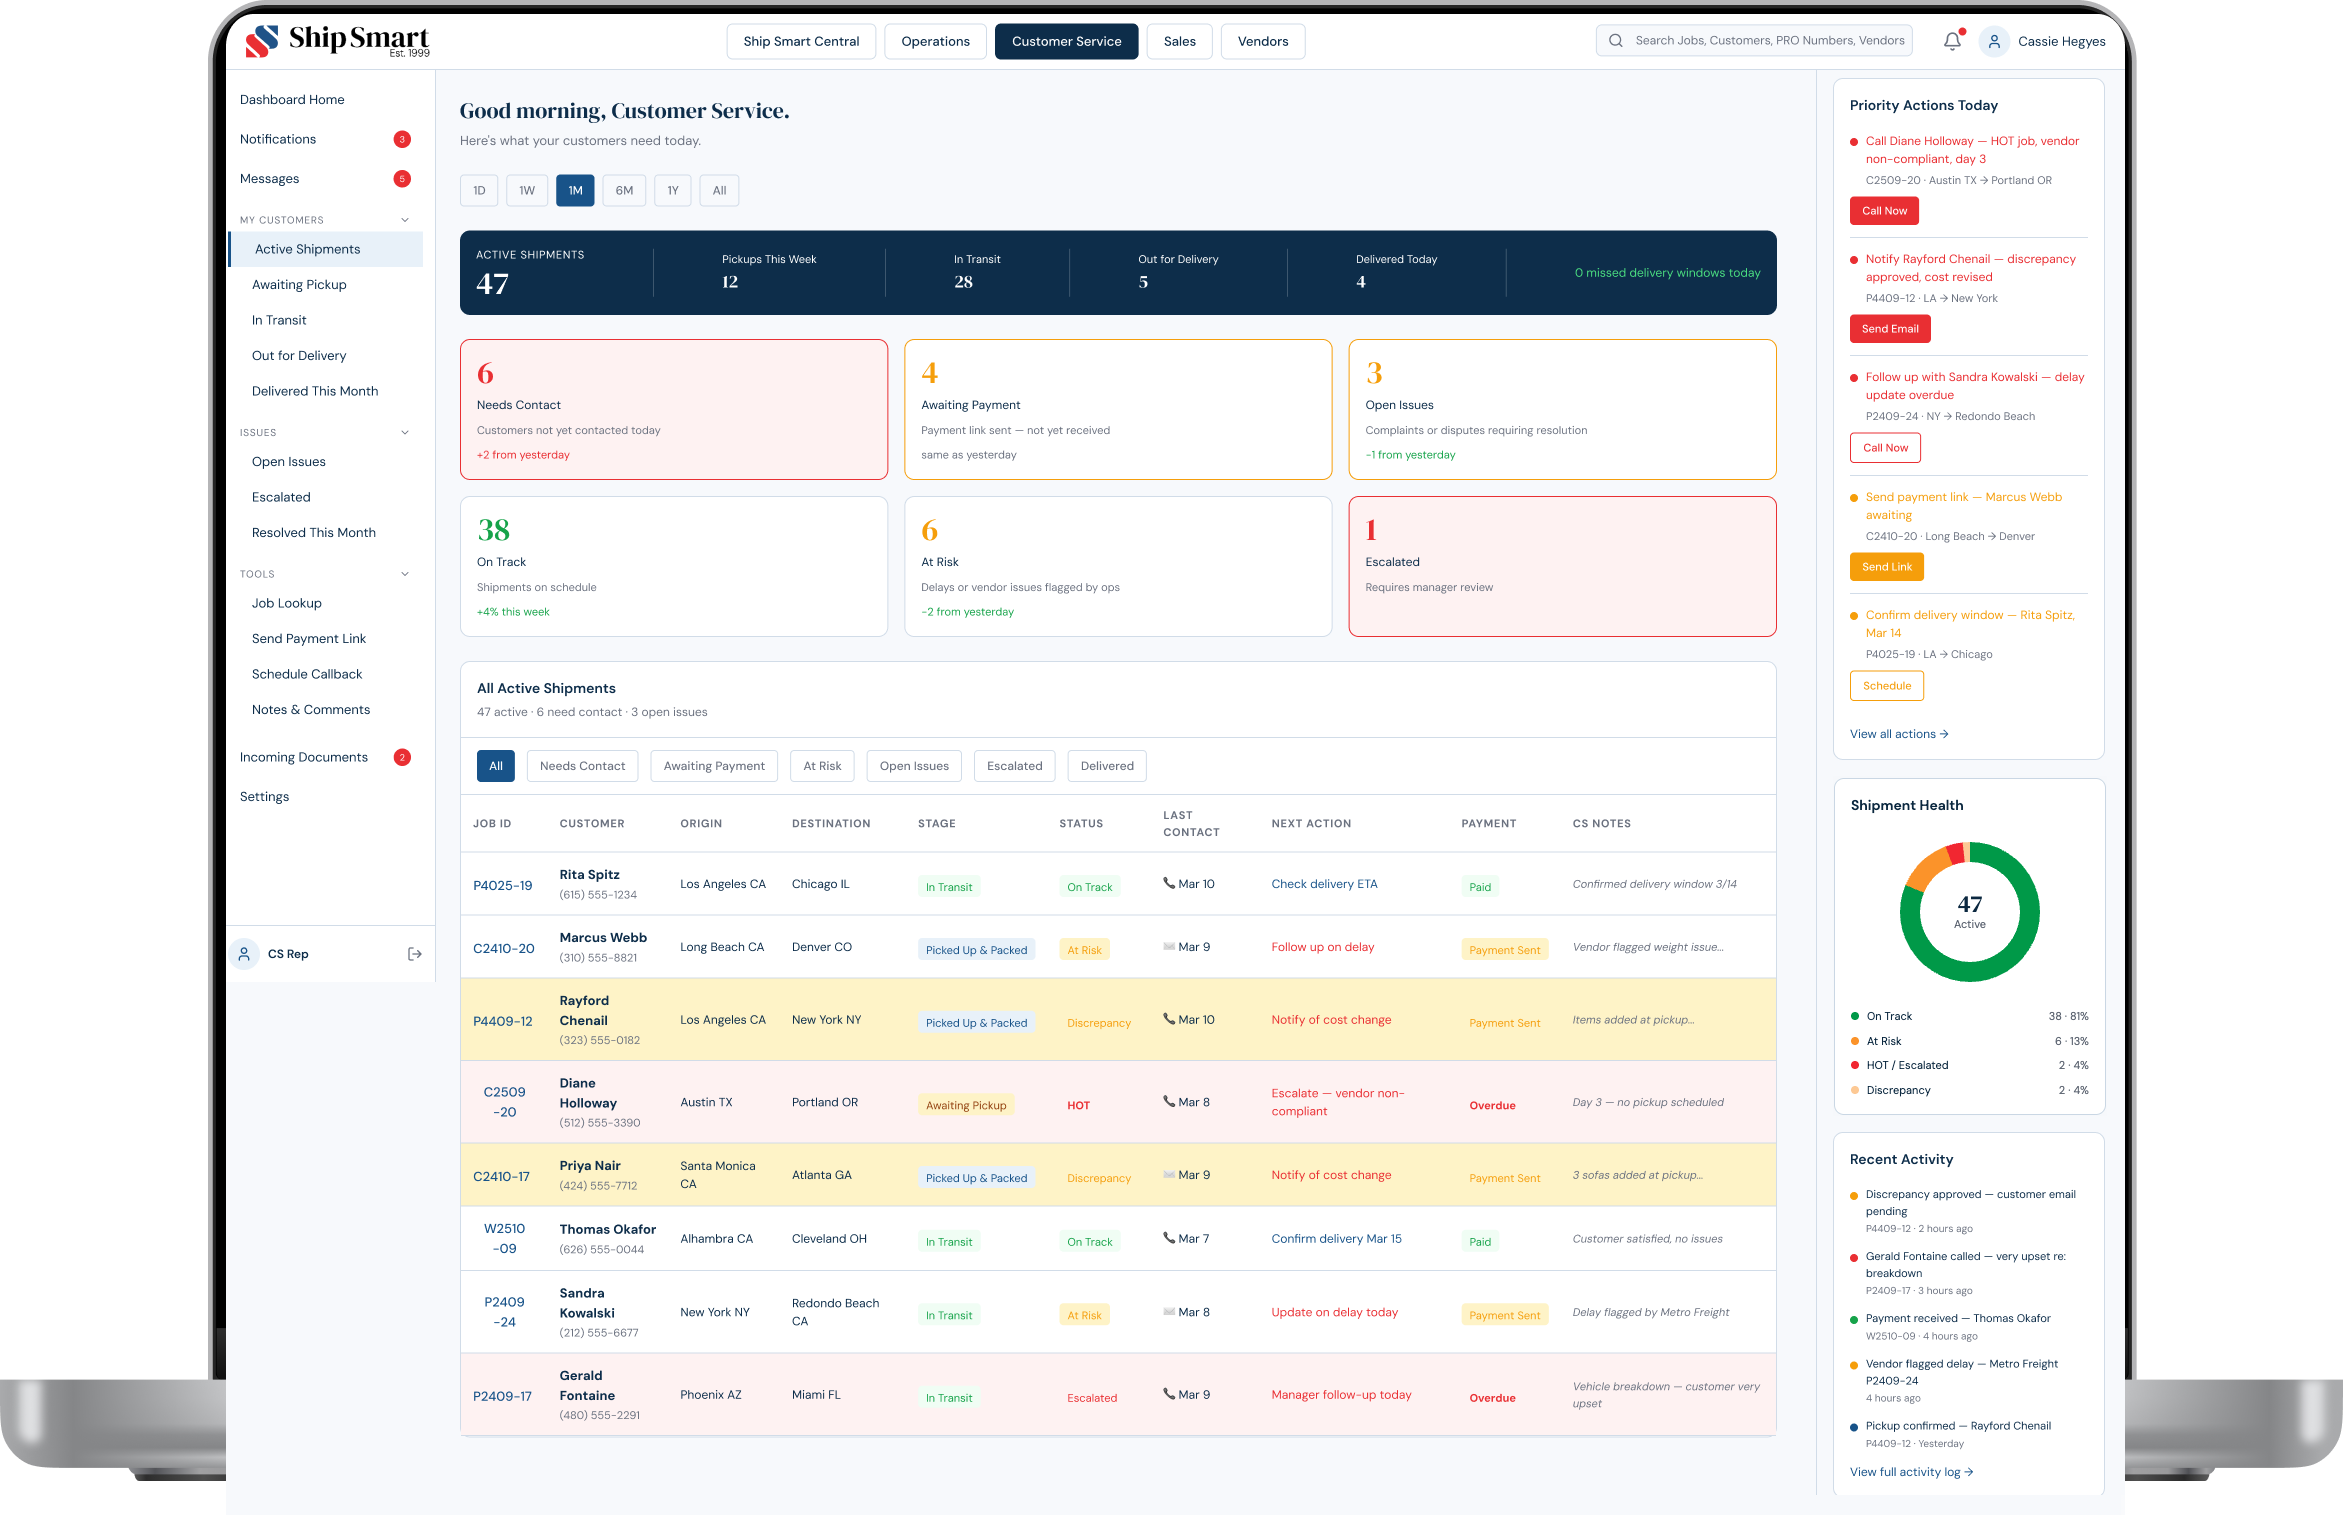
Customer Service Dashboard— Relationship Management Layer
Customer Service sees the same lifecycle system through a customer relationship lens. Each row connects a customer account, shipment stage, payment status, and next required action.
Customer Service — Discrepancy Handling
When Operations approves a discrepancy, it surfaces in Customer Service as a Cost Revision Pending card, not a notification or email, but a structured action item within the customer detail panel.
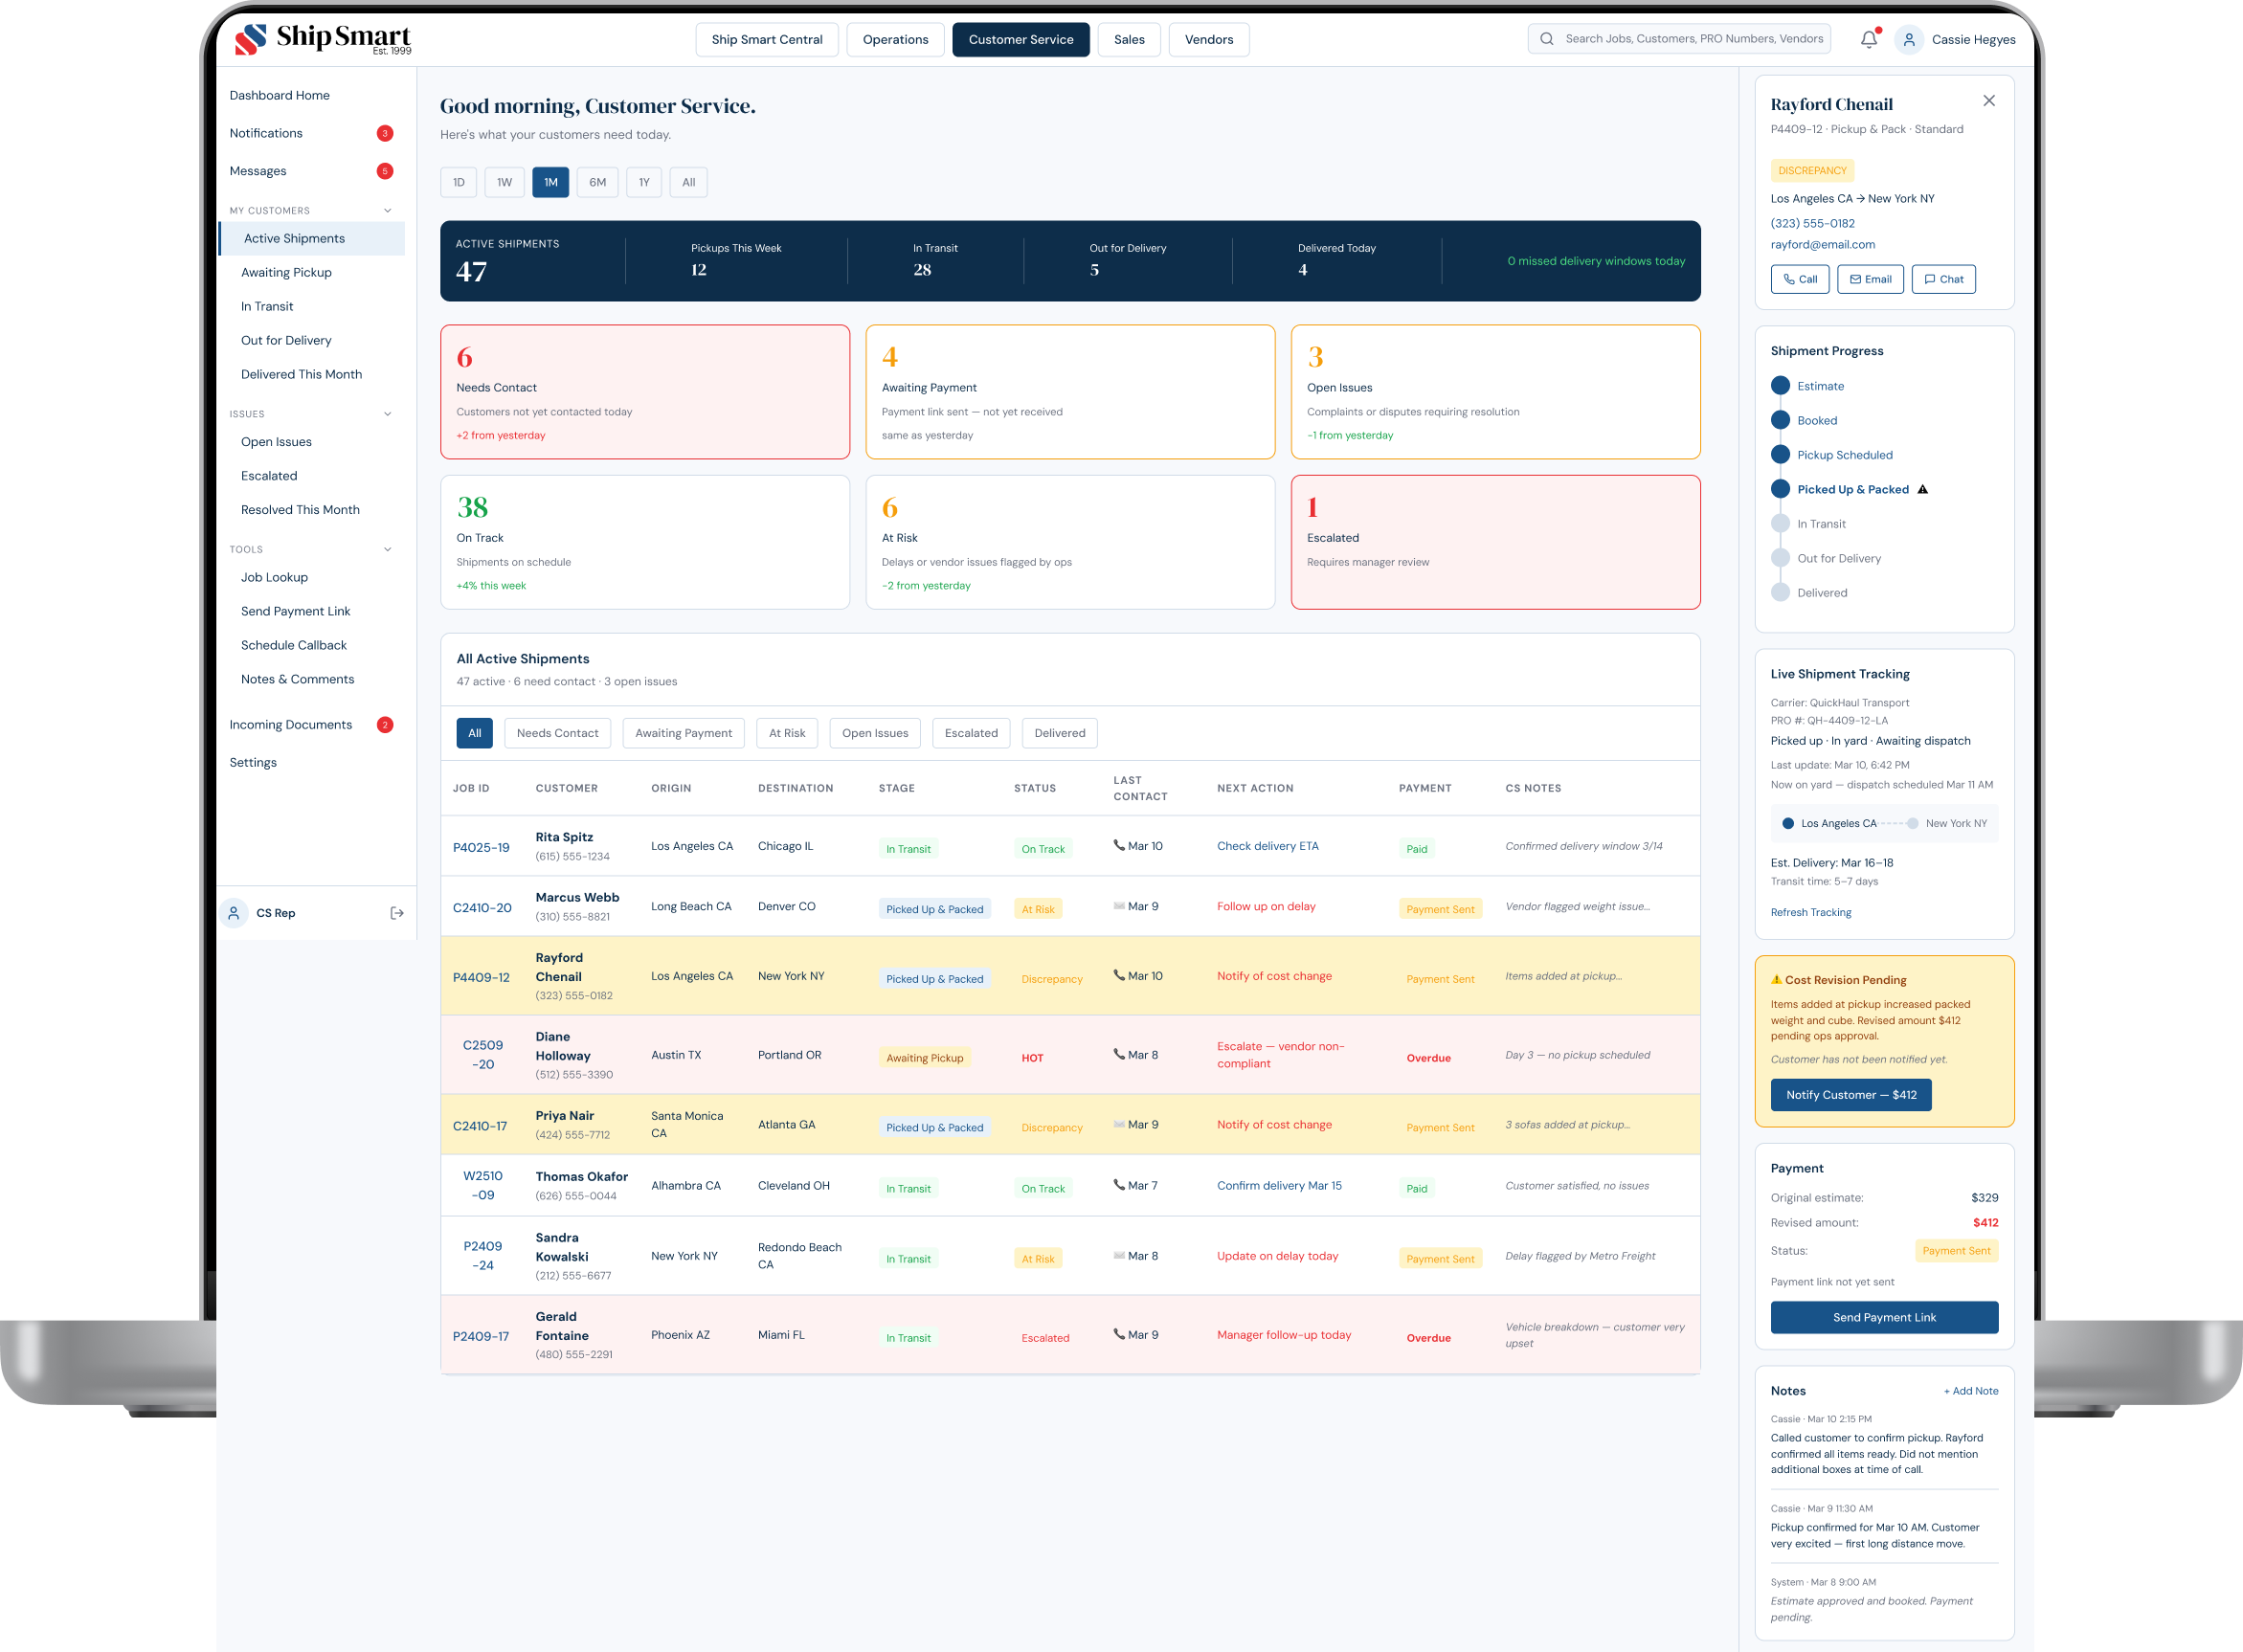
This is the same event shown in the Operations discrepancy panel: the same data, surfaced for a different job to be done.
Sales Dashboard — Pipeline Visibility
The Sales dashboard connects revenue performance directly to operational reality: conversion rate, quote-to-close funnel, at-risk quotes, and team commission tracking.

Sales - Team Overview
Sales — Individual Performance
Each rep has a personal performance view with revenue vs. goal, commission breakdown, ranked open quotes, and customer lifetime value. Operational signals surface directly in the pipeline.
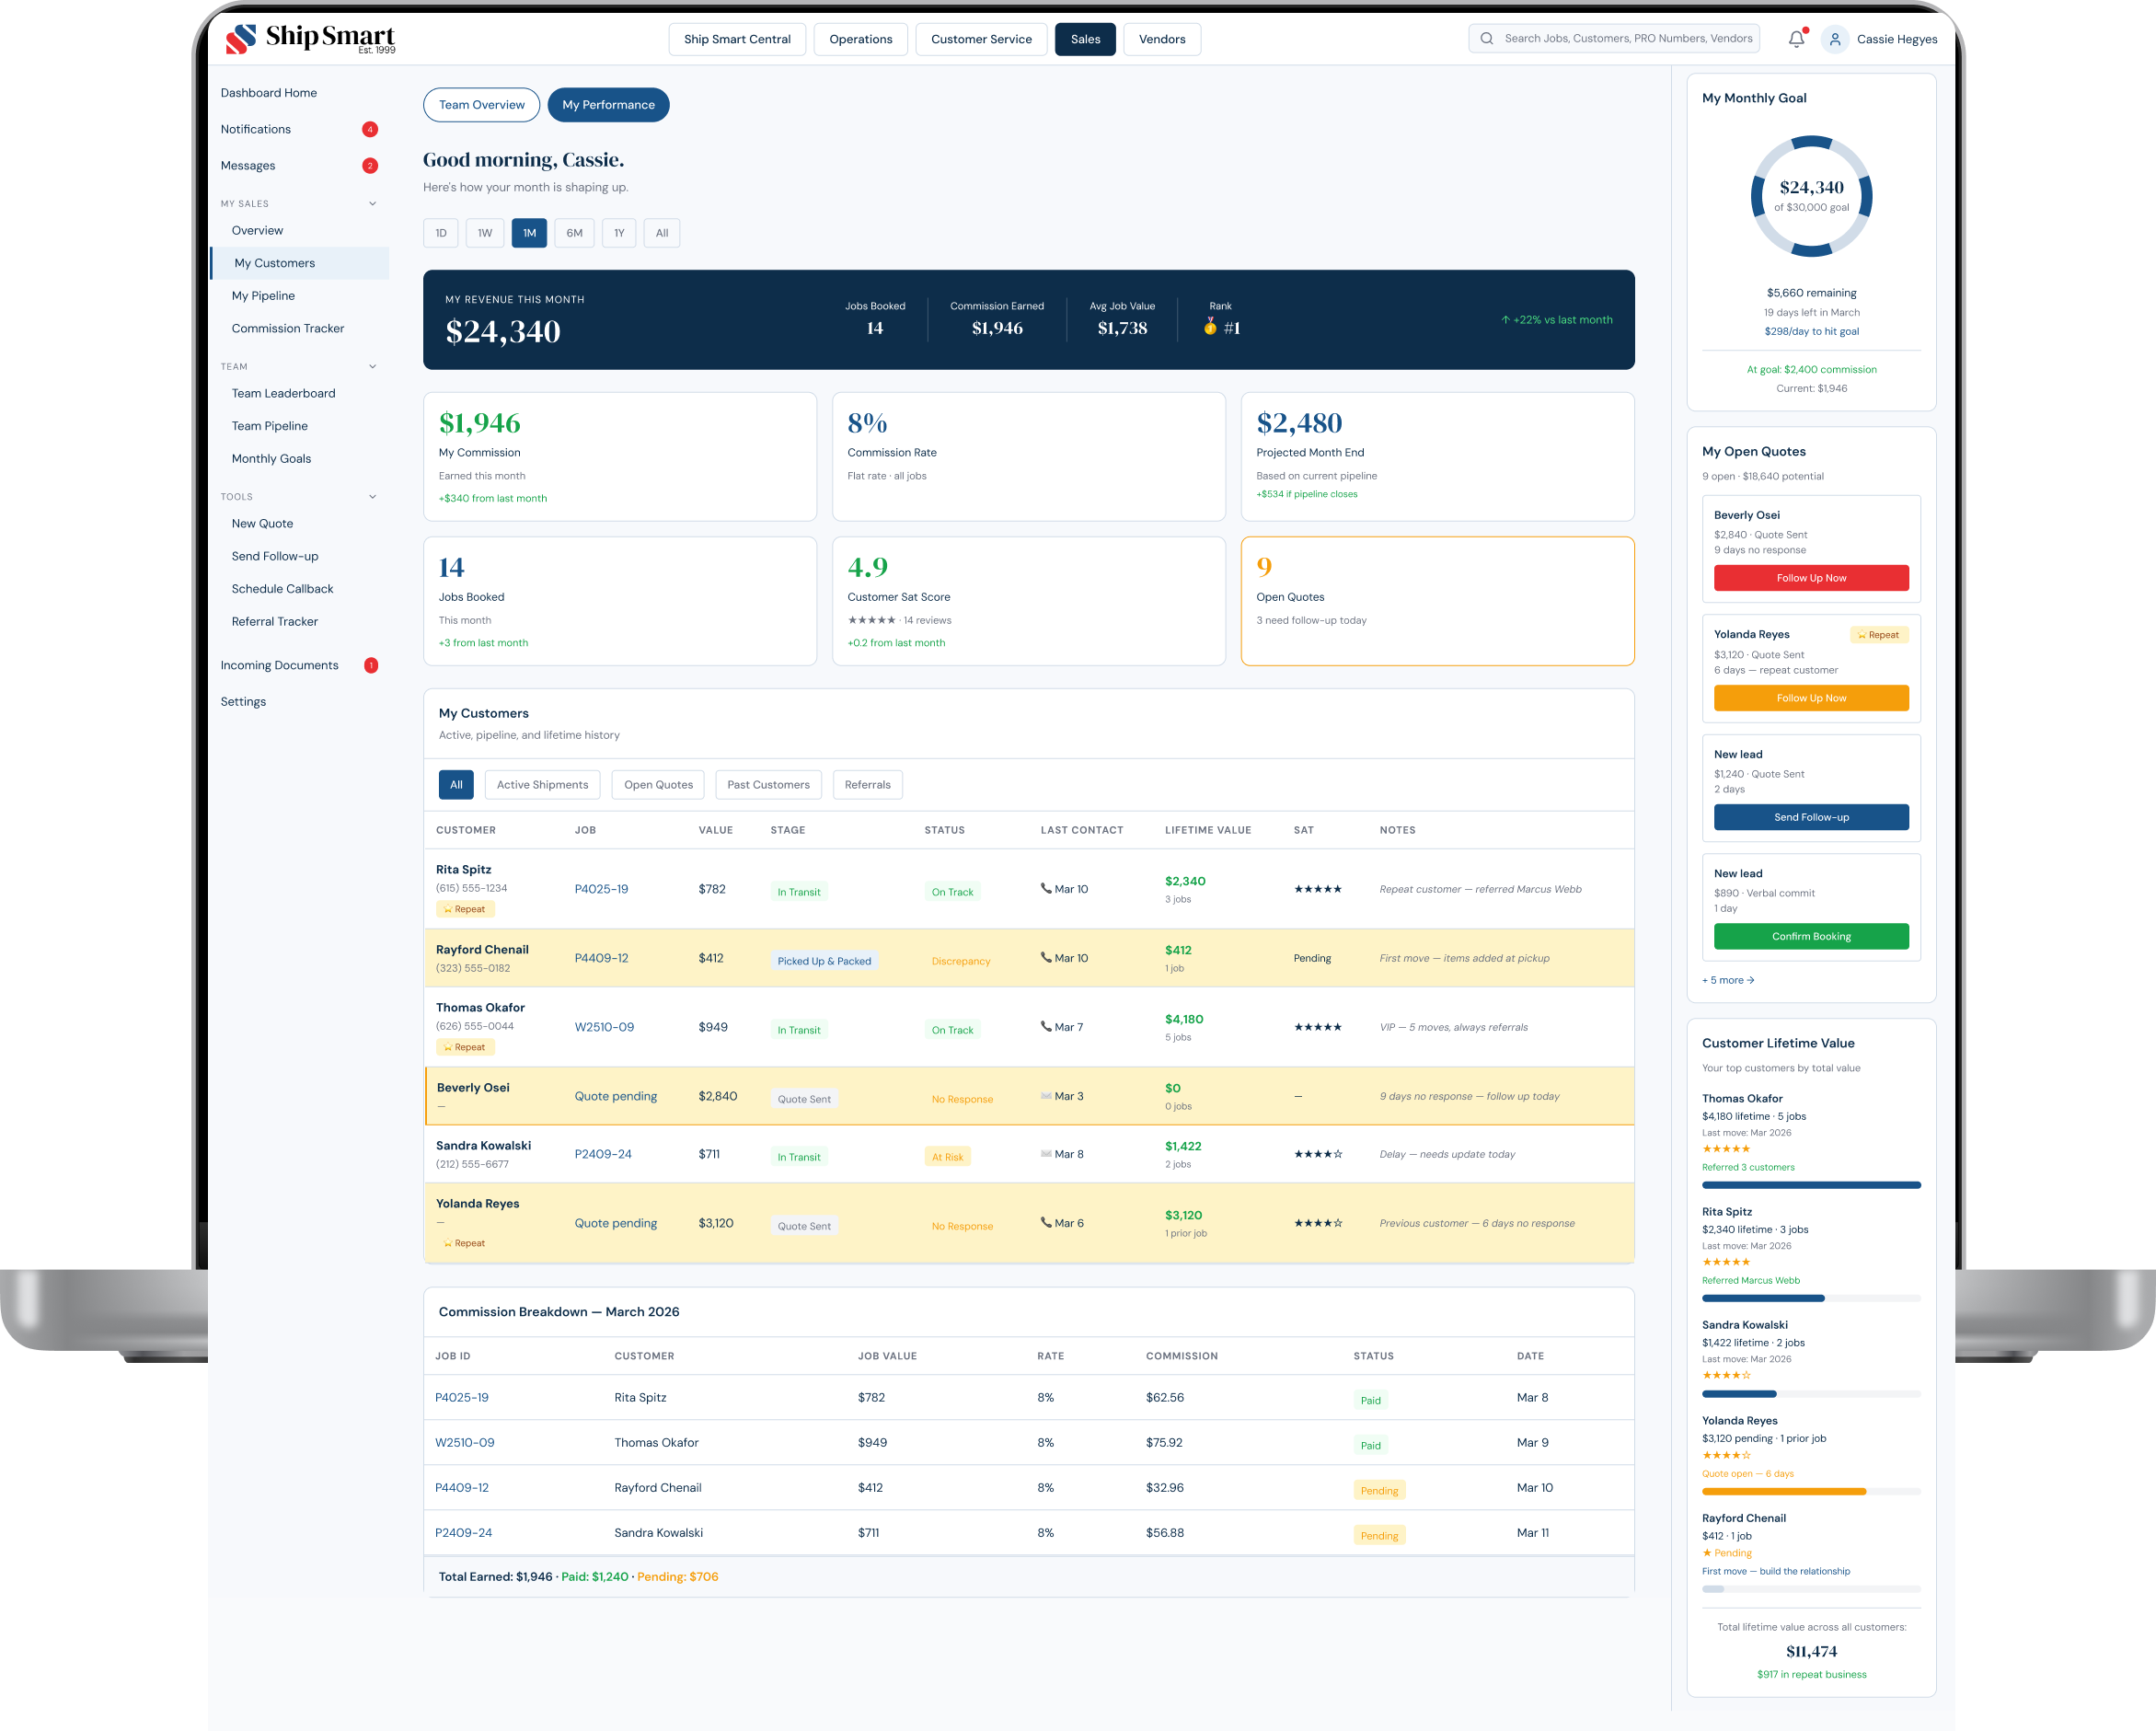
Rayford Chenail appears with a pending discrepancy flagged, connecting the rep's pipeline directly to the operational state of their jobs.
Vendor Management Dashboard — System-Level Governance
The vendor layer operates across two connected surfaces. Internal view: 412 vendors, compliance scores, discrepancy queue, performance tracking. External view: vendor-managed job updates, compliance, and discrepancy decisions. Same underlying data. Two completely different jobs to be done.

Vendor Management — Vendor Detail Panel
Selecting a vendor opens the detail panel, active jobs, compliance score, all documents with expiry dates, pending invoices, and open discrepancies. The View Vendor Portal button opens the vendor's own external view of this same account.

Premium Logistics shows the healthy state: all docs green, no open discrepancies.
Vendor Portal — Structured Vendor Input
The Vendor Portal replaces email-thread coordination with structured workflows. Vendors log in as their own company, manage jobs, and respond to discrepancies through a defined decision flow.
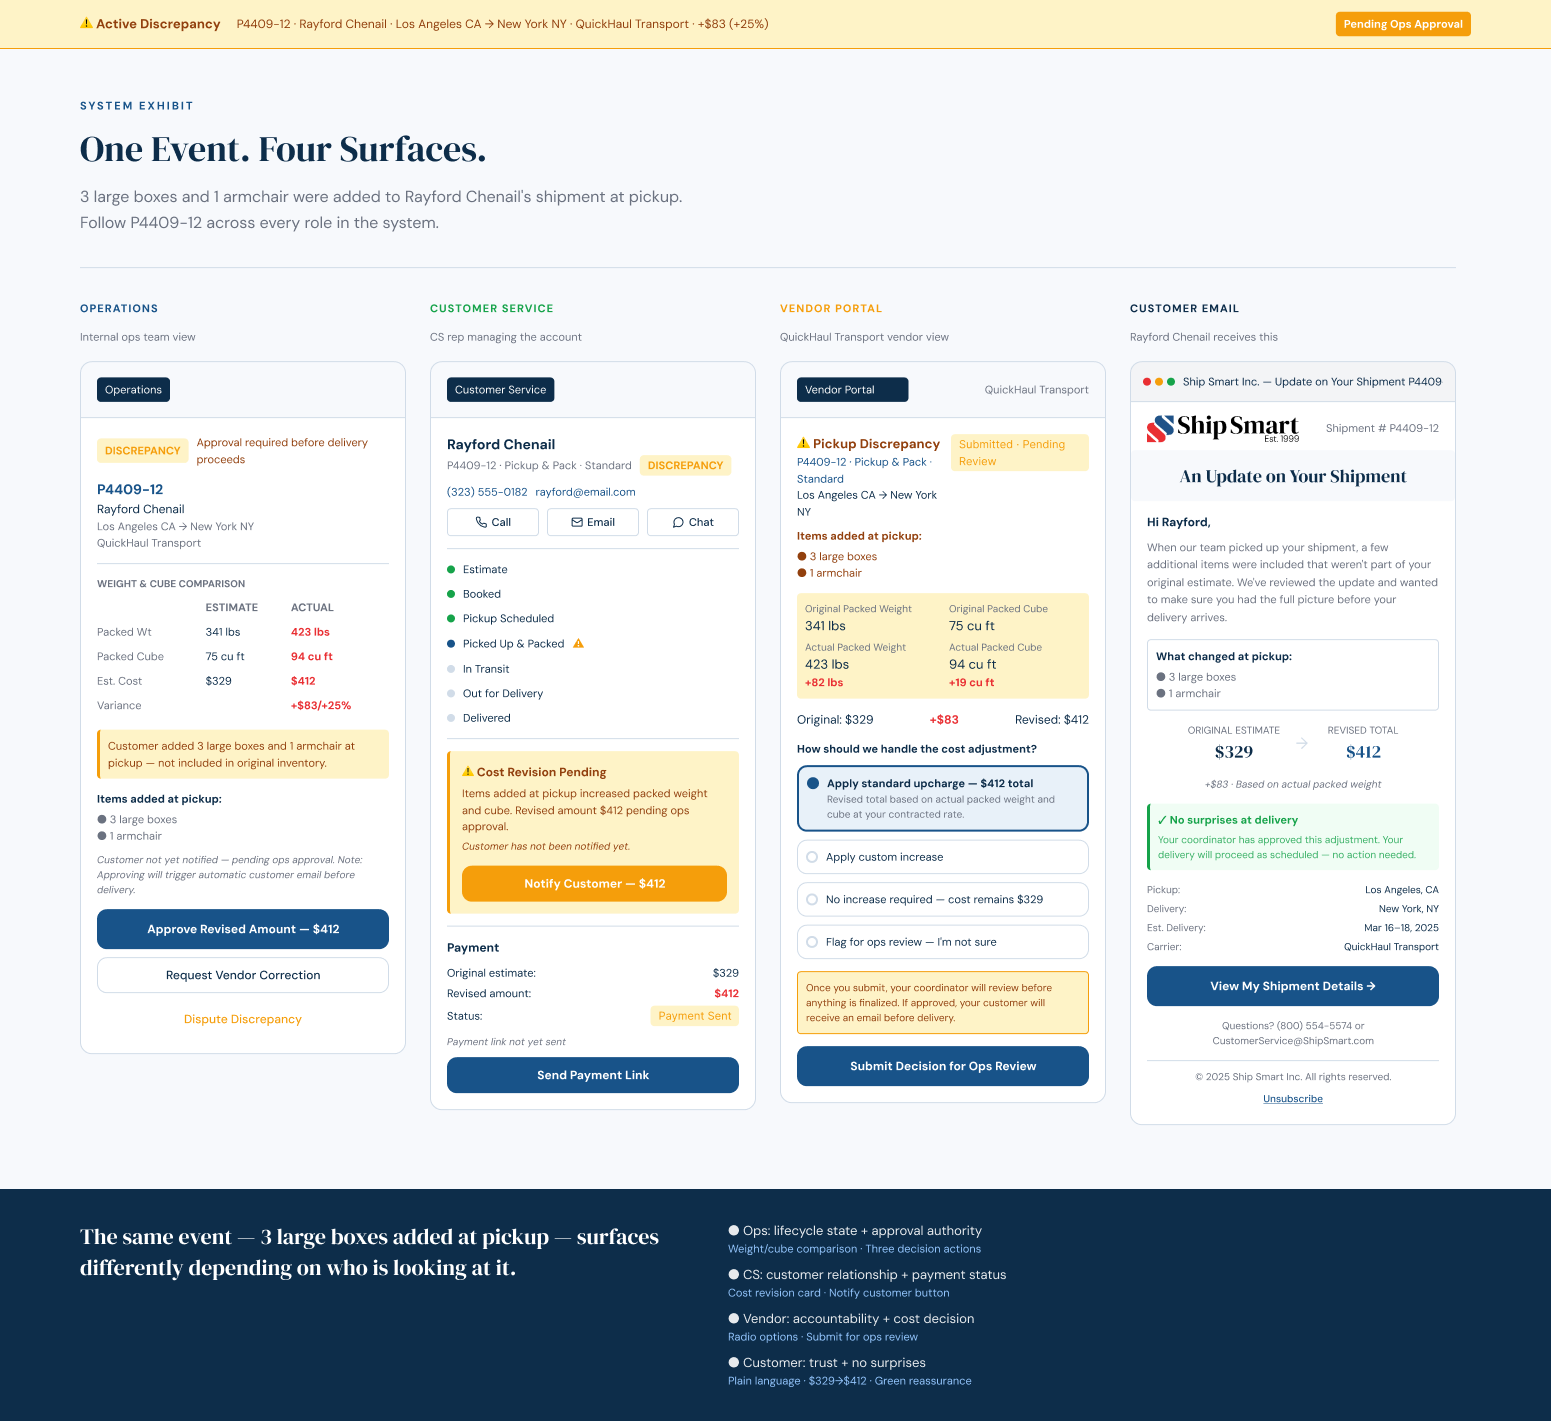
One Event. Four Surfaces.
The same event 3 large boxes added at pickup surfaces differently depending on who is looking at it. In the vendor portal it's a decision prompt. In Ship Smart Central it's a pending approval. In Customer Service it's a cost revision card. For the customer, it's a proactive email with no surprises. Same data. Four completely different jobs to be done.
OPERATIONS
Pending approval
CUSTOMER SERVICE
Cost revision card
VENDOR PORTAL
Decision prompt
CUSTOMER
Proactive email, no surprises
Same data. Four completely different jobs to be done.
Triggered Customer Email — Discrepancy Alert
When Operations approves a discrepancy, the system automatically generates and sends a customer update. No manual drafting. No Customer Service action required.
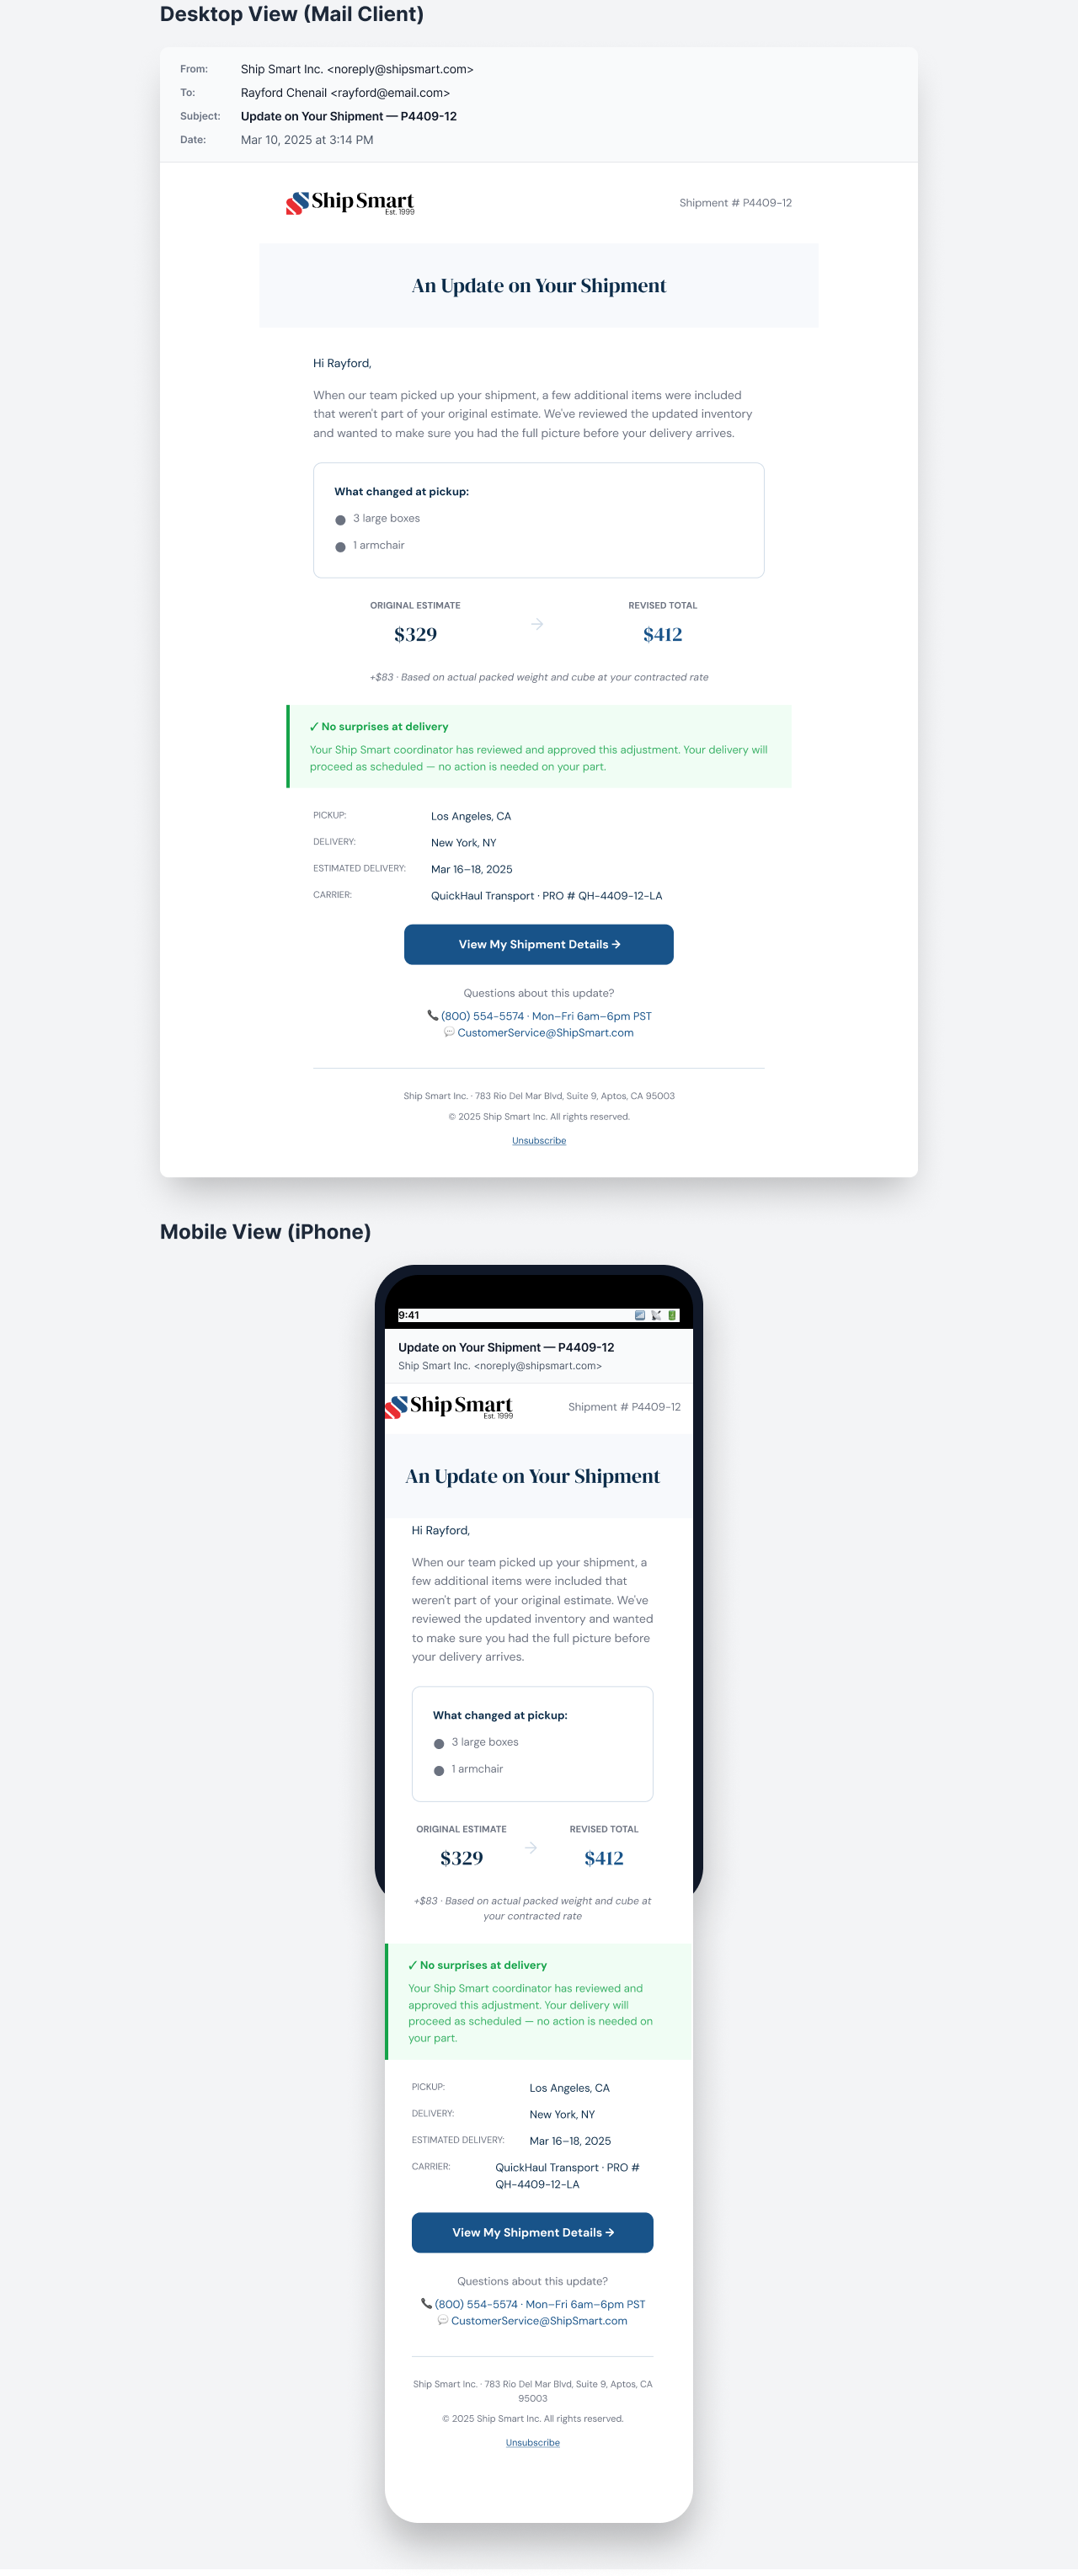
"No surprises at delivery" addresses the trust gap identified in research: customers who knew what changed before delivery did not contact support.
Ship Smart Central established a unified system of record connecting Vendors, Sales, Operations, and Support within a shared workflow architecture.
Business Results
BEFORE → AFTER
| Vendors updated via email, 24–72hr delays after pickup → 92% vendor compliance with structured job cards
| 49% of all support contacts were status questions → 60% fewer status-related calls
| 21% of contacts were follow-ups to unanswered questions → 40% reduction in follow-up emails
ADDITIONAL OUTCOMES
$5.86
saved per support call
40%
reduction in internal status-related chasing
17%
increase in CSAT
23
lifecycle states automated, zero manual drafting
BUSINESS IMPACT
| Reduced operational load through automated state logic
| Improved vendor accountability through system-driven governance
| Increased predictability across the shipment lifecycle
| Strengthened customer trust through proactive updates
| Reduced duplication and accelerated future product development
Customer Sentiment After Ship Smart Central
Customer reviews after Ship Smart Central launched. The complaints that defined the previous state, no updates, no visibility, no accountability, stopped appearing. The same lifecycle changes that reduced support demand by 60% are what customers were describing in their own words.
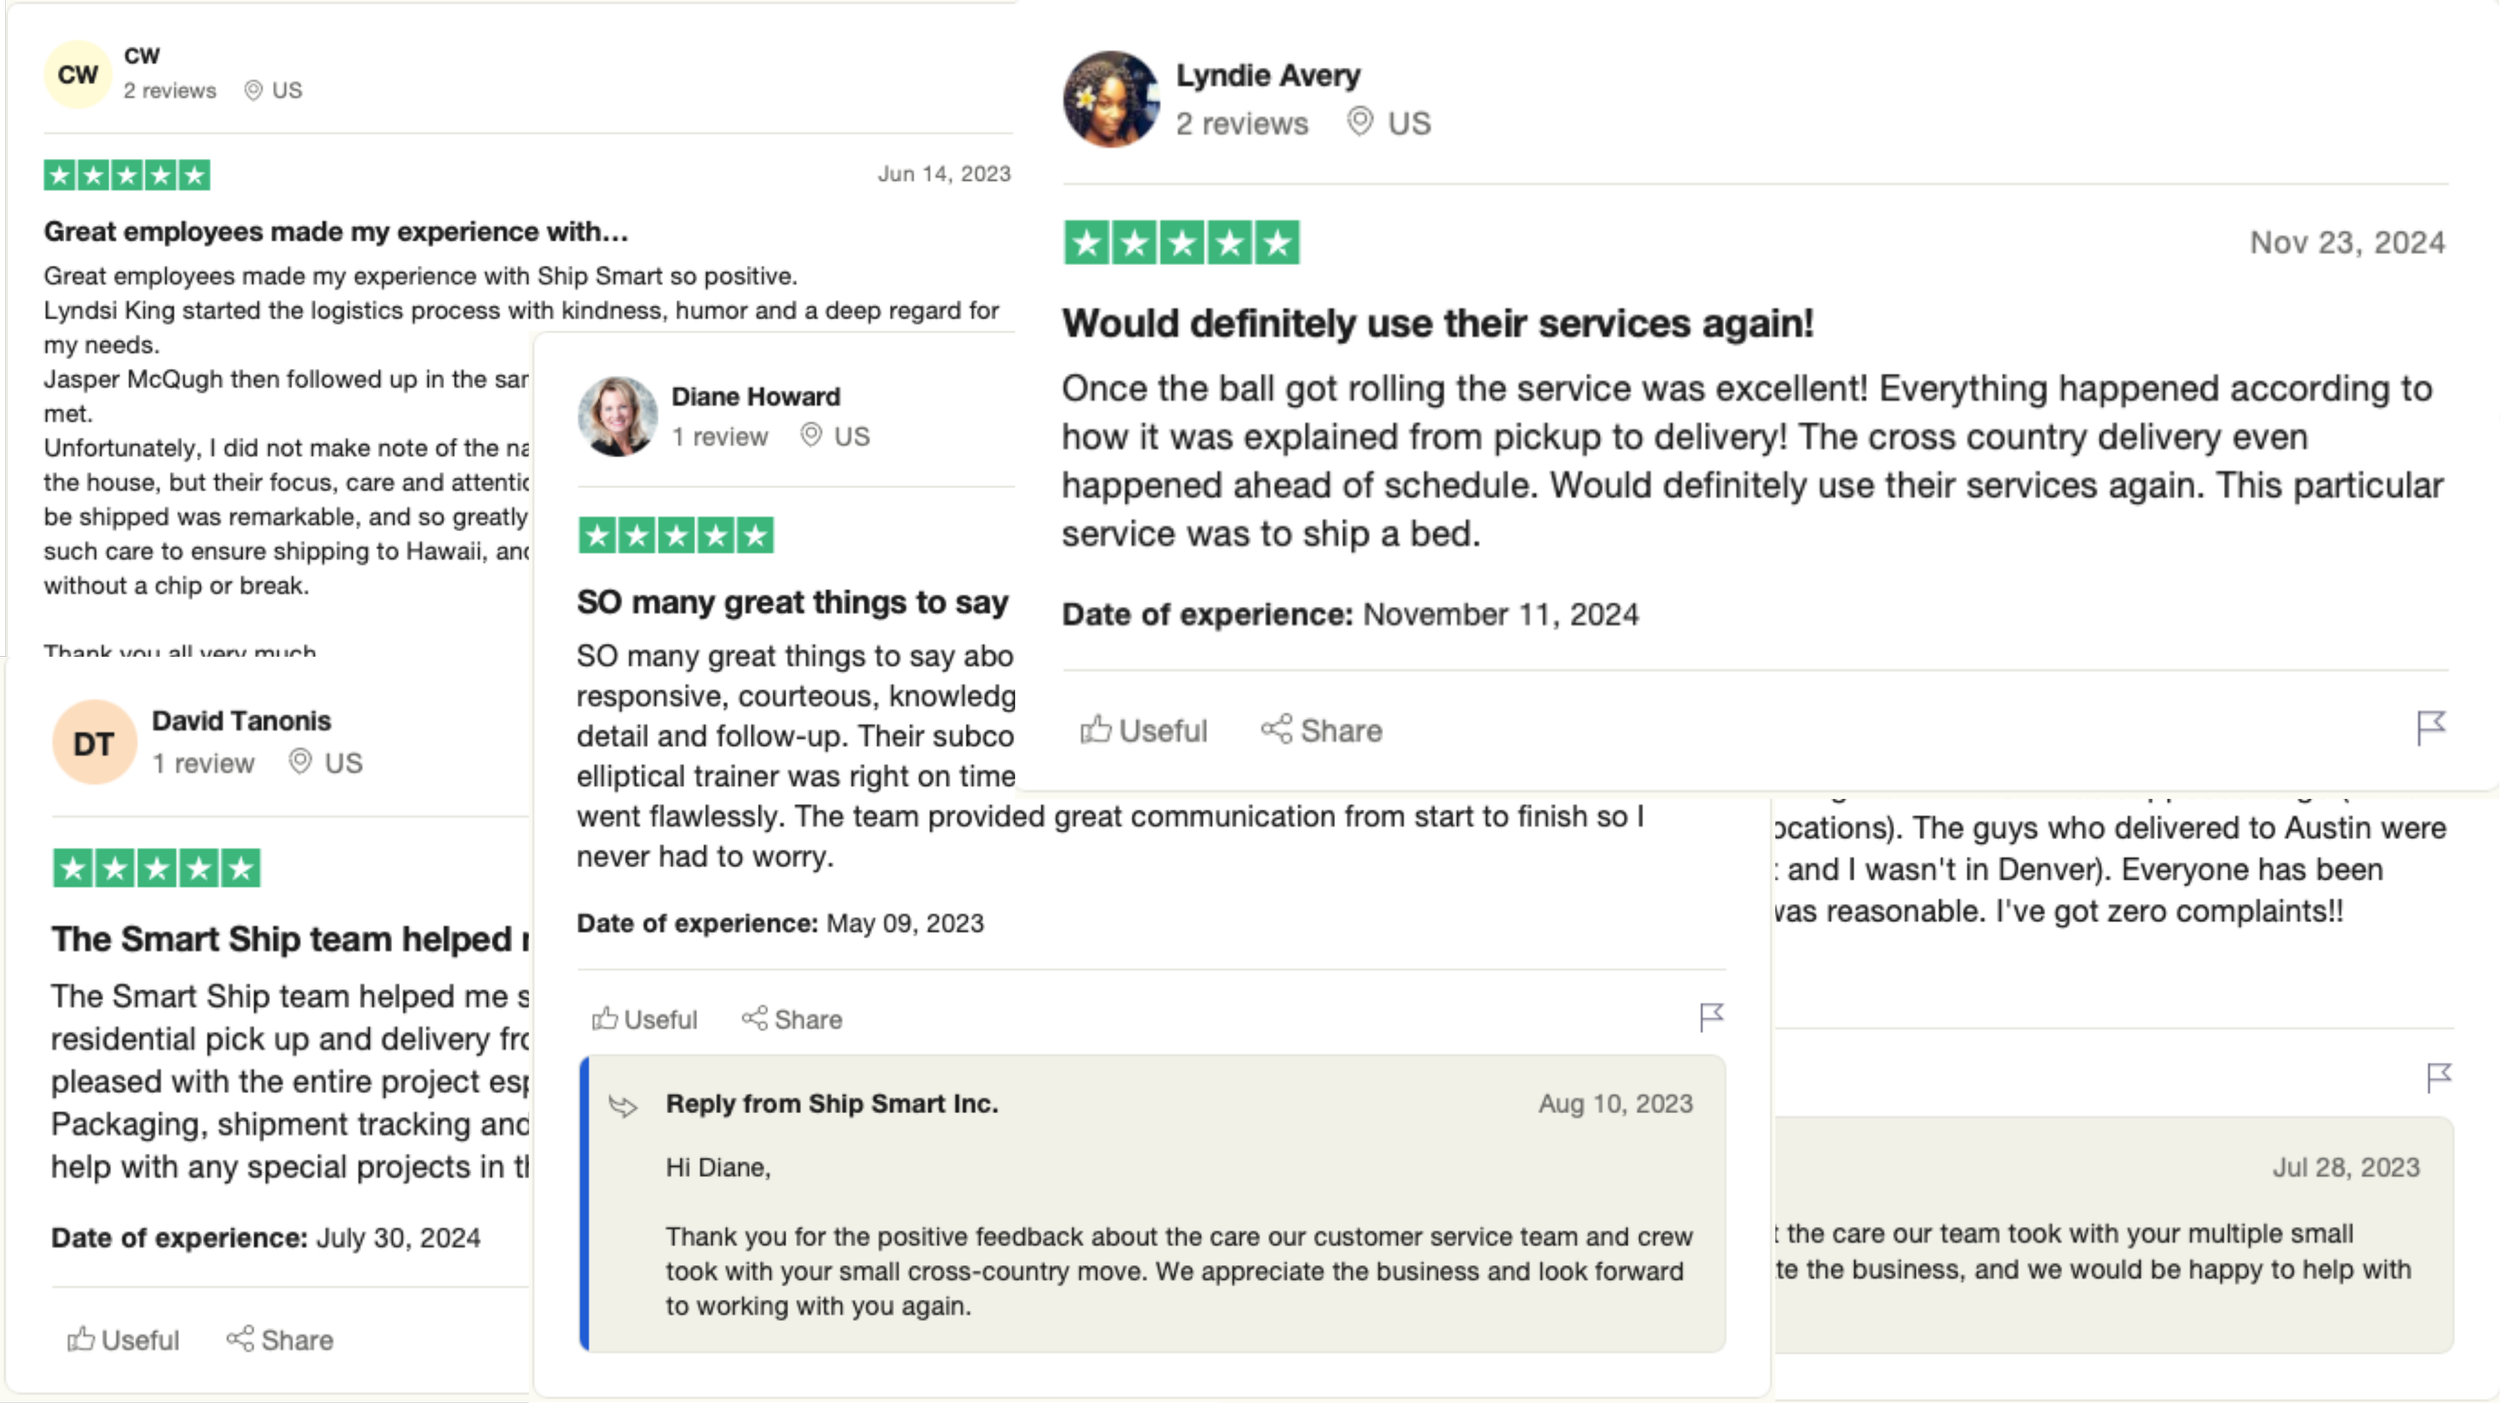
After Ship Smart Central launched, the complaints that defined the previous state stopped appearing in customer reviews.
What I Learned
Ship Smart Central reshaped how I think about operational transparency in multi-party systems. Customer trust was not a communication problem. It was a state-modeling problem.
When lifecycle ownership, status logic, and event triggers are undefined, friction cascades across teams and surfaces as support demand. Designing a shared system of record transformed reactive coordination into structured accountability.
The lifecycle state model built here shares its underlying logic with the AI conversation system in the Product Operating System. Both are built on the same principle: when system states are clearly defined, downstream communication becomes predictable.
Operational UX is not behind-the-scenes support. It is revenue protection infrastructure.
How This Connects
This project is one part of a broader platform transformation. Ship Smart Central established the operational backbone: a shared system of record enabling lifecycle visibility, vendor accountability, and cross-team coordination.
The lifecycle model built here directly informs the AI-assisted conversation layer in the Product Operating System. Both are grounded in the same principle: when system states are clearly defined, system behavior becomes predictable across every surface.
More Case Studies
Self-Service Pricing & Quoting Platform
+24% completion · +18% conversion · 45% fewer correction loops